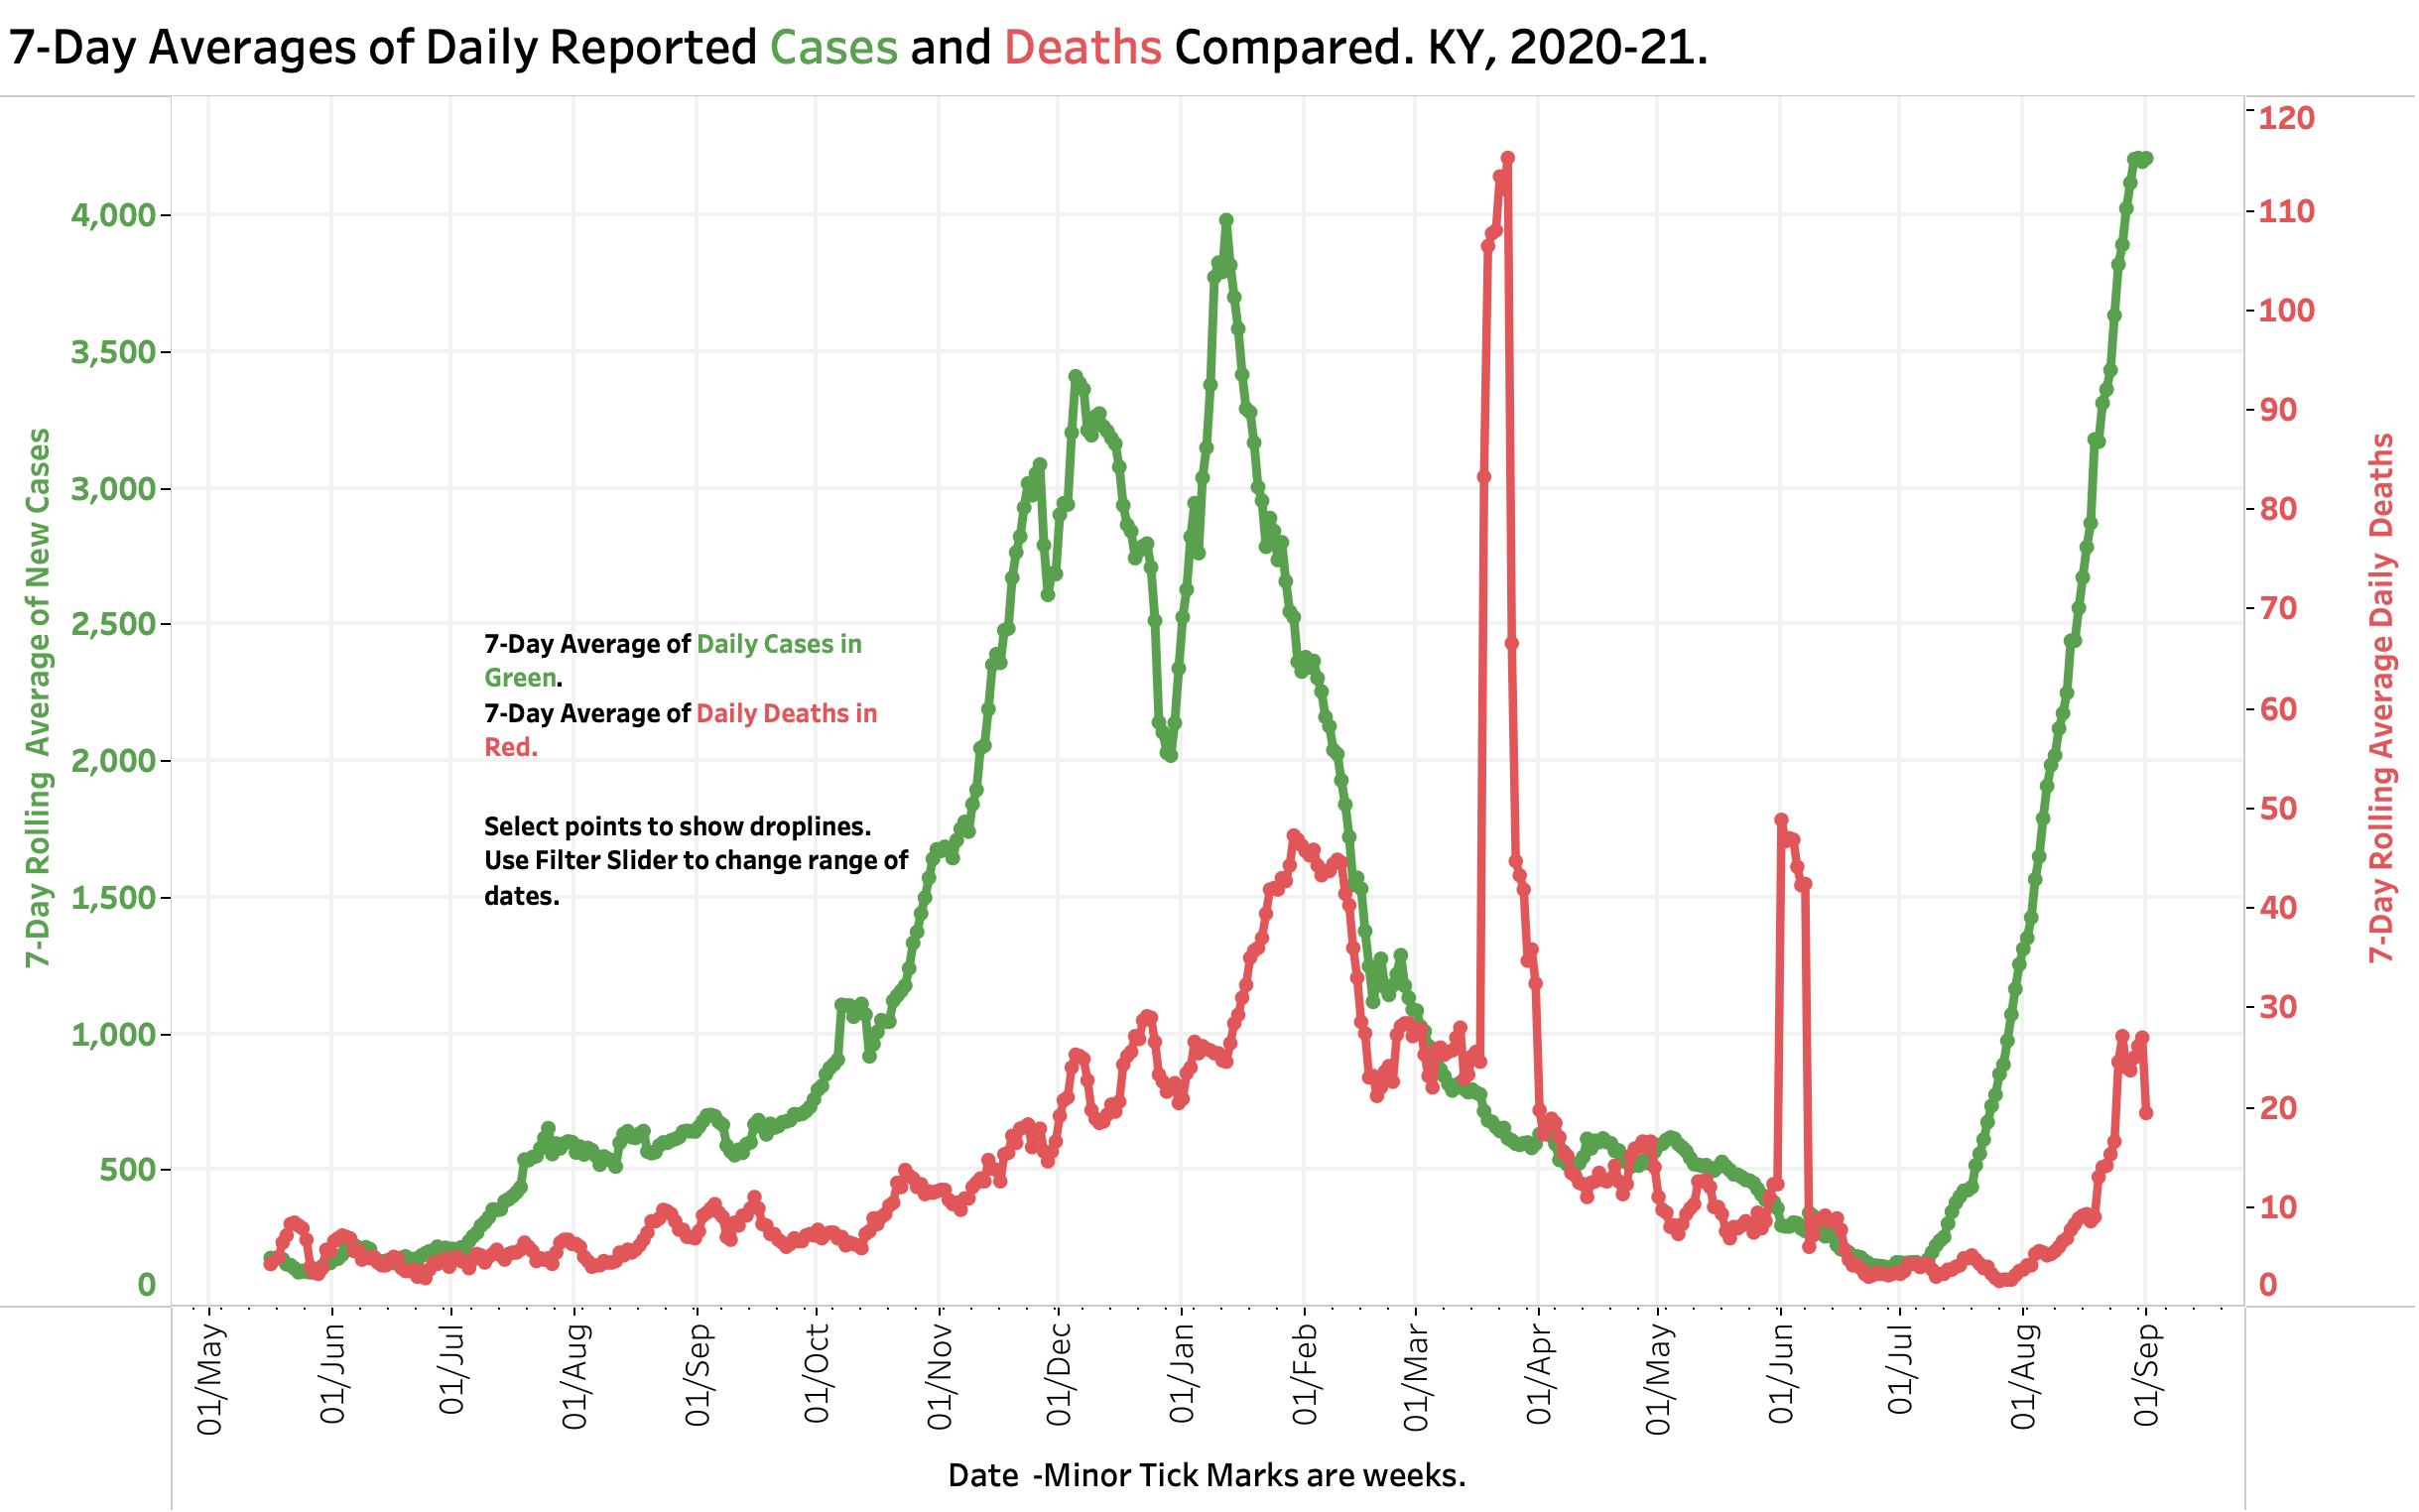
As of Wednesday September 1, several lines of data point to a decreasing rate of new reported cases if not a peaking– albeit at record high levels. However, hospitalizations and deaths are expected to rise further!
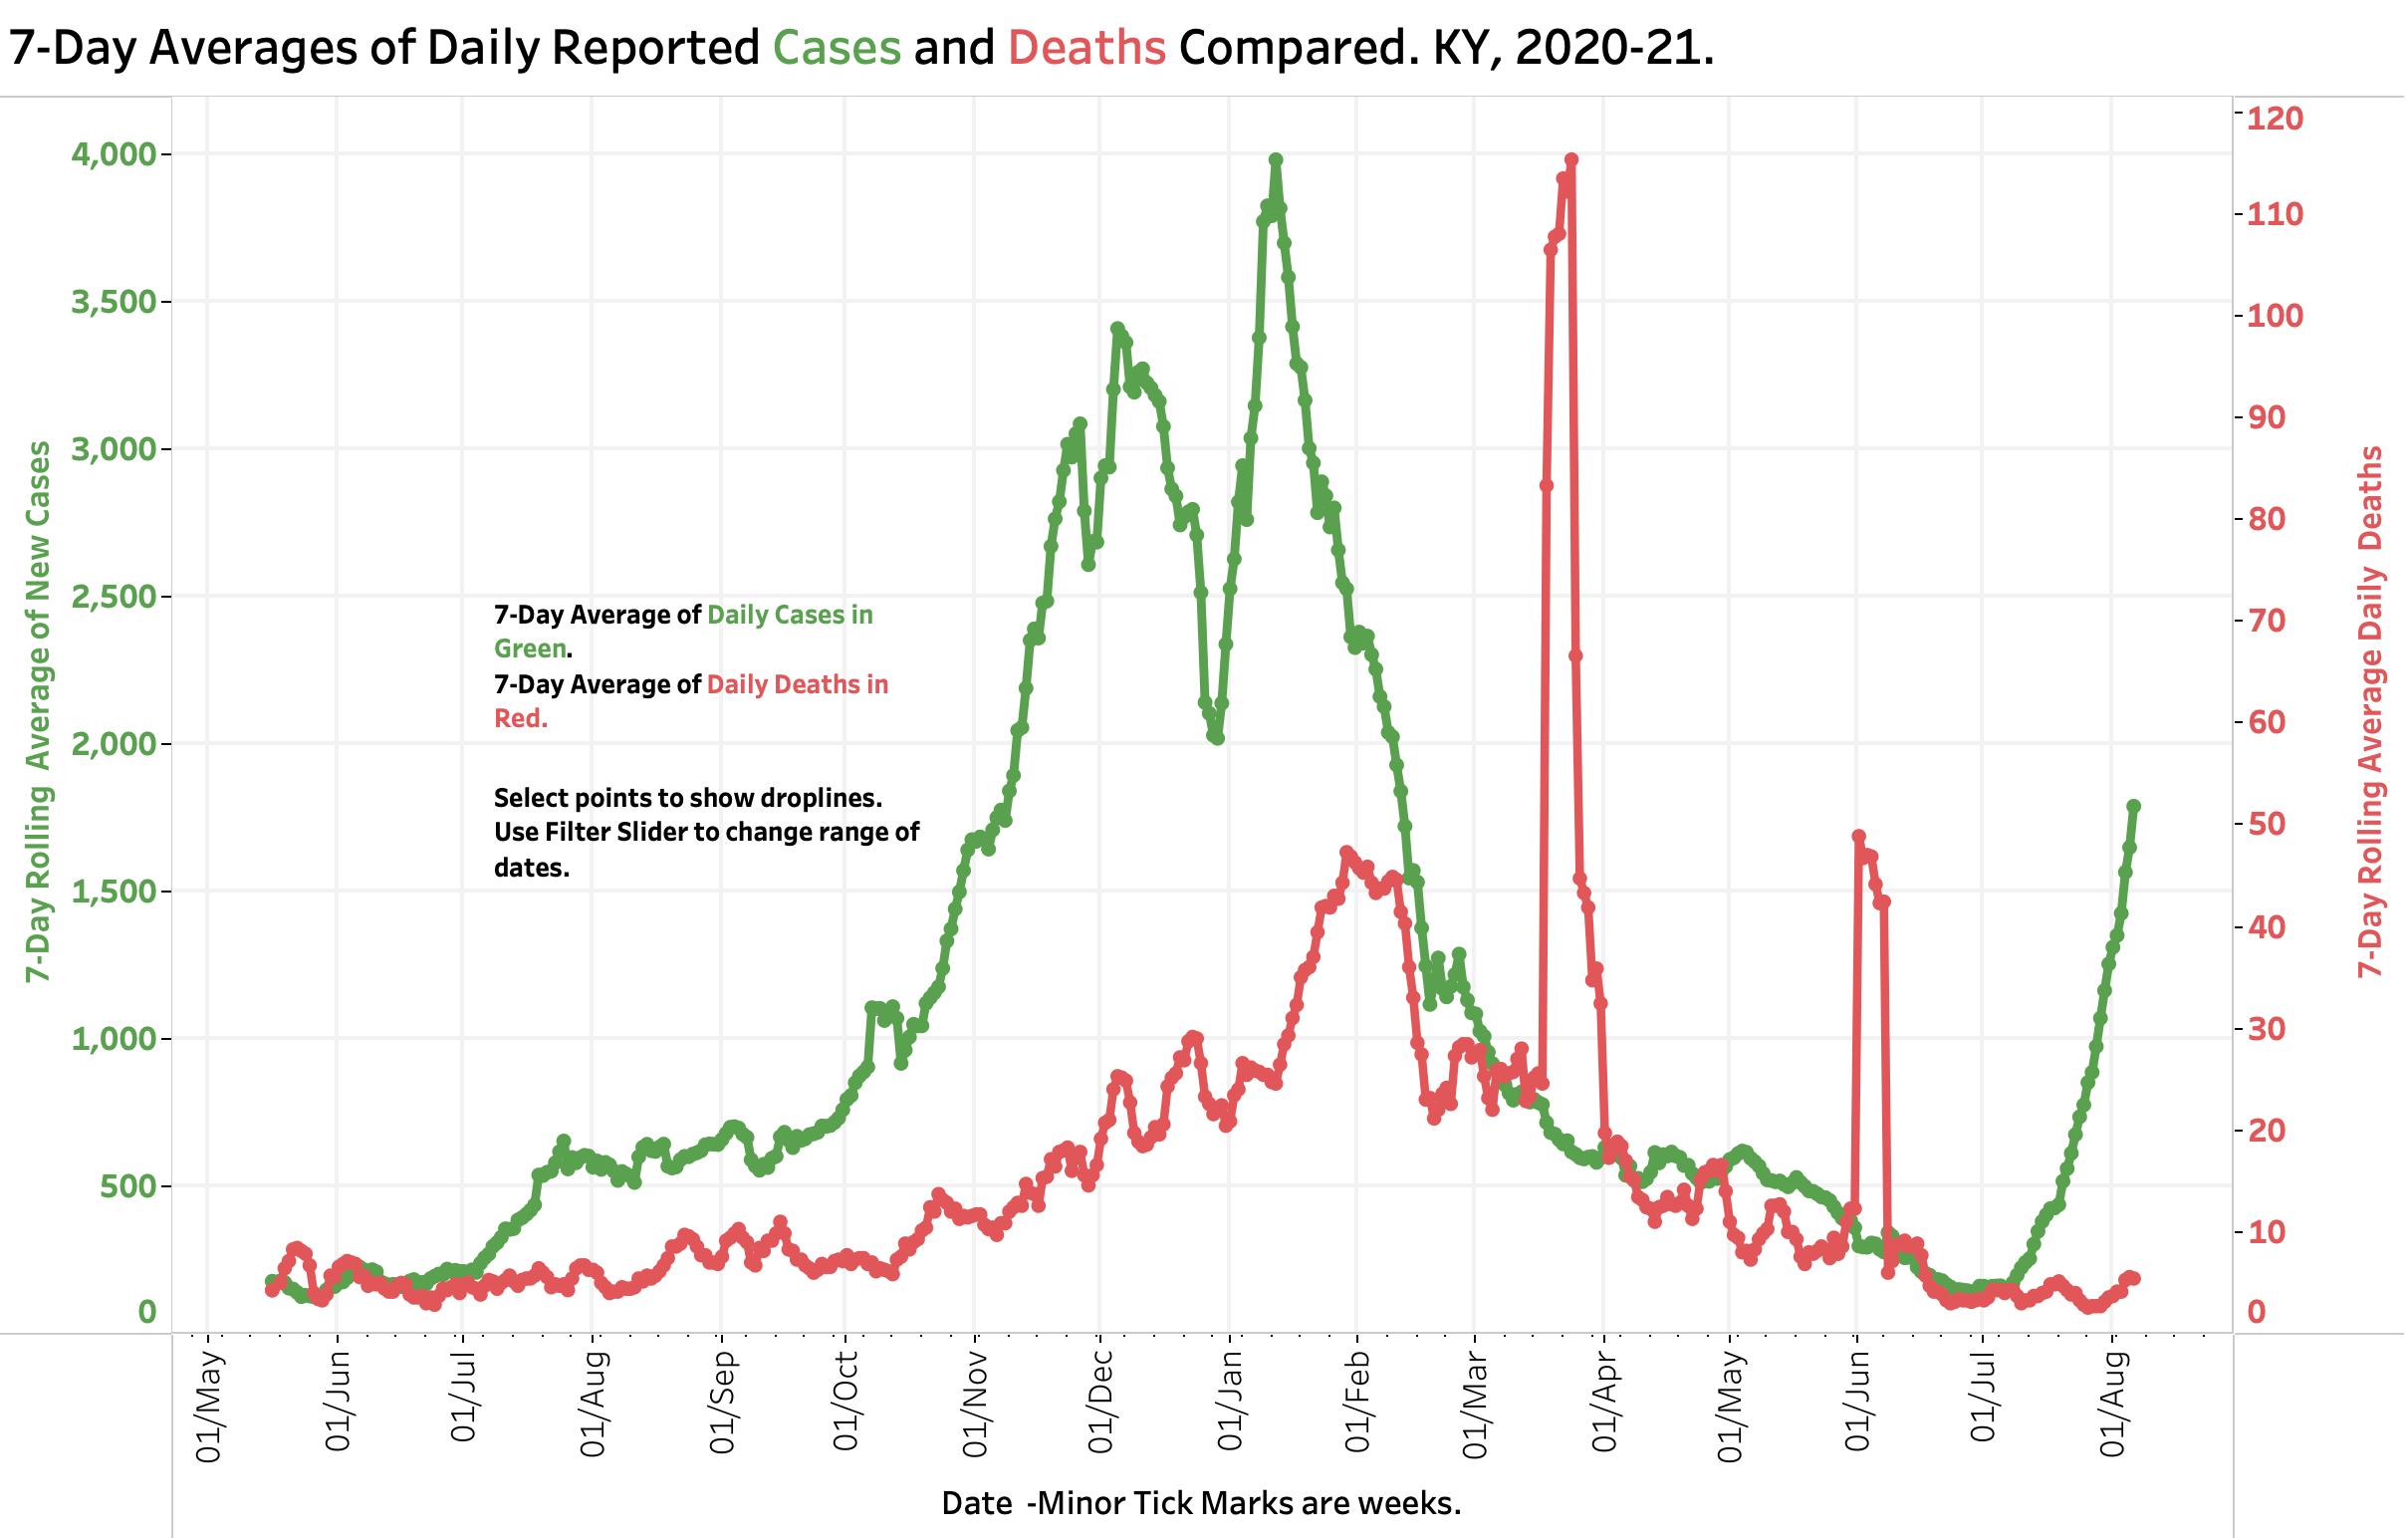
Cases: It’s hard to be content with 4941 new cases Wednesday. Last week delivered the highest number of cases in any week of Kentucky’s epidemic, even higher than those of last December and January. Except for one aberrant reporting day on January 6, last week contained the two highest daily case counts for the entire 544 days of known Coronavirus in our state. The 28,850 new net cases added last week (from Sunday through Saturday) were 2,423 more than the highest week of last Winter! This August had only 618 cases fewer than the previously high month of month of January 2021. Today’s 7-Day average of new cases of 4,212 is the highest to date even with the low counts over the weekend. The 14-Day average is also at a record high.
Covid-19 Cases and Deaths as of 9-1-2021. Kentucky
7-Day and 14-Day Averages of New Cases. When the 7-Day average of new cases is higher than the 14-Day average, the epidemic is expanding. When the 14-Day average is higher, the reverse is true. The difference between the two averages gives a measure of the the rate of expansion or contracture of epidemic spread. While the 7-Day remains higher as of 9-1-2021, the difference between the two is as small as it has been since early July. Until the last day of June when our epidemic was still shrinking, the 14-Day average was higher.
It’s January all over again in August– except for the temperature!
Tuesday’s New Case, Test Positivity Rate, and Hospital data continue their sharp rises equaling or exceeding the worst days of the epidemic in January. There are no reliable signs of things slowing down.
New Cases. The number of new cases reported yesterday was 4,638. Of these,29% were in children and teenagers 18 and under. This was by far the highest number of Tuesday cases since the beginning of the epidemic, higher even than the 4,127 cases reported last December 1. Similarly, Monday’s new case count of 2,596 was the highest ever for that day. The counts of the previous Thursday, Saturday, and Friday were in the range of the worst of last winter’s surge.
Without further changes in public behaviors, at this rate of epidemic expansion, Kentucky can hit 10,000 new cases per day by the end of August.
Yesterday, Friday August 13, there were 4009 new cases of Covid-19 reported in Kentucky. The last time more than 4000 cases were reported was January 14 when we were still in the worst of Covid times of the Commonwealth. The highest daily report of new cases to date was 5705 on January 6. Review of daily case reports, test positivity rates (TPR) and Covid-19 hospital utilization all reveal that we are circling back from the lowest indicators of epidemic activity back to the highest in a matter of only 6 weeks.
The usual displays of daily, weekly, and monthly cases, deaths, and tests are available on KHPI’s Tableau website. Below are three different data visualizations that show were we have been, and where we appear to be going.
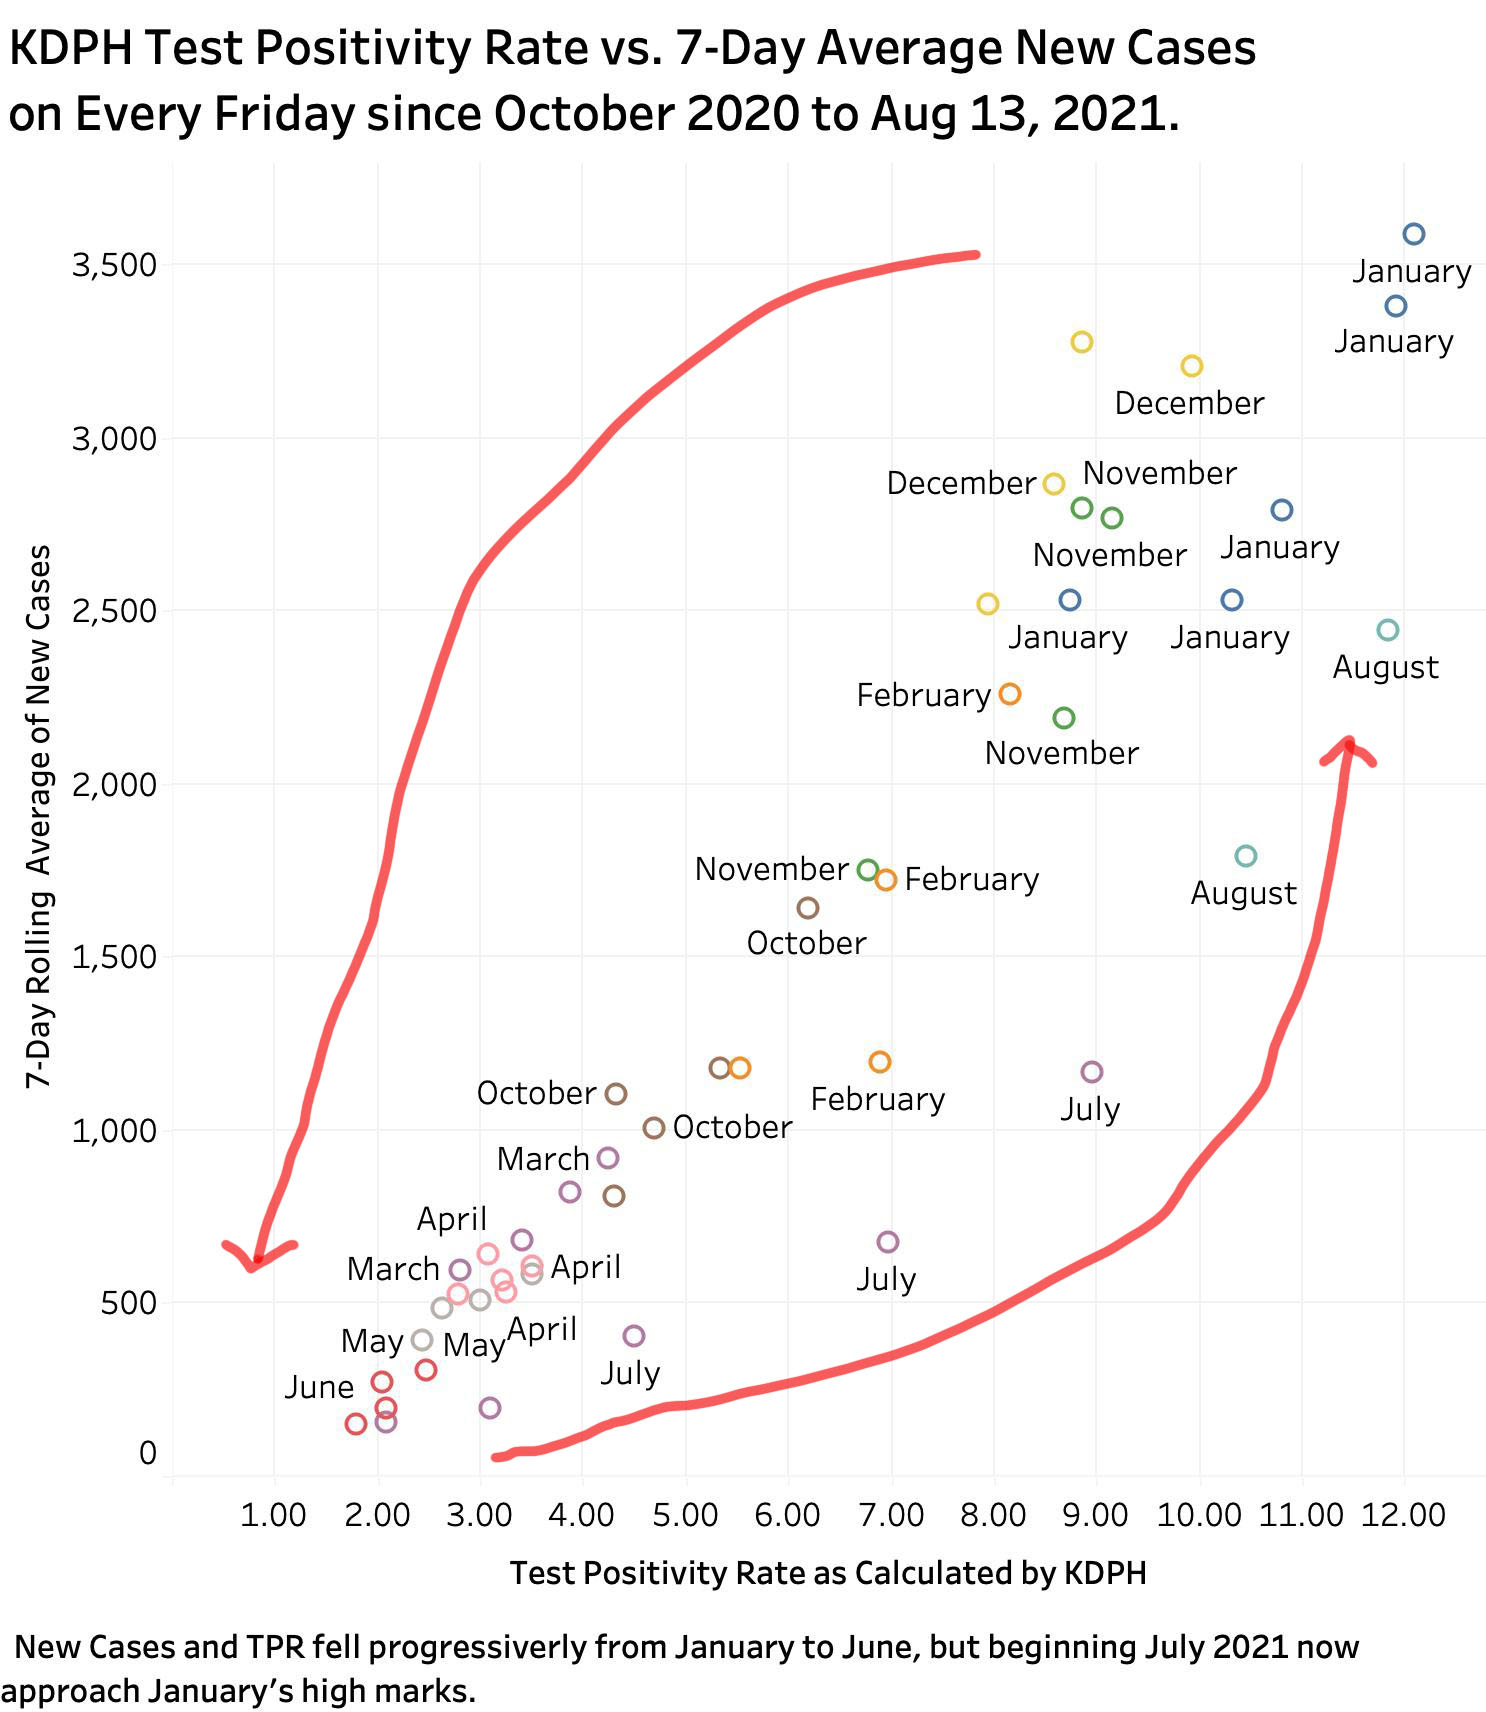
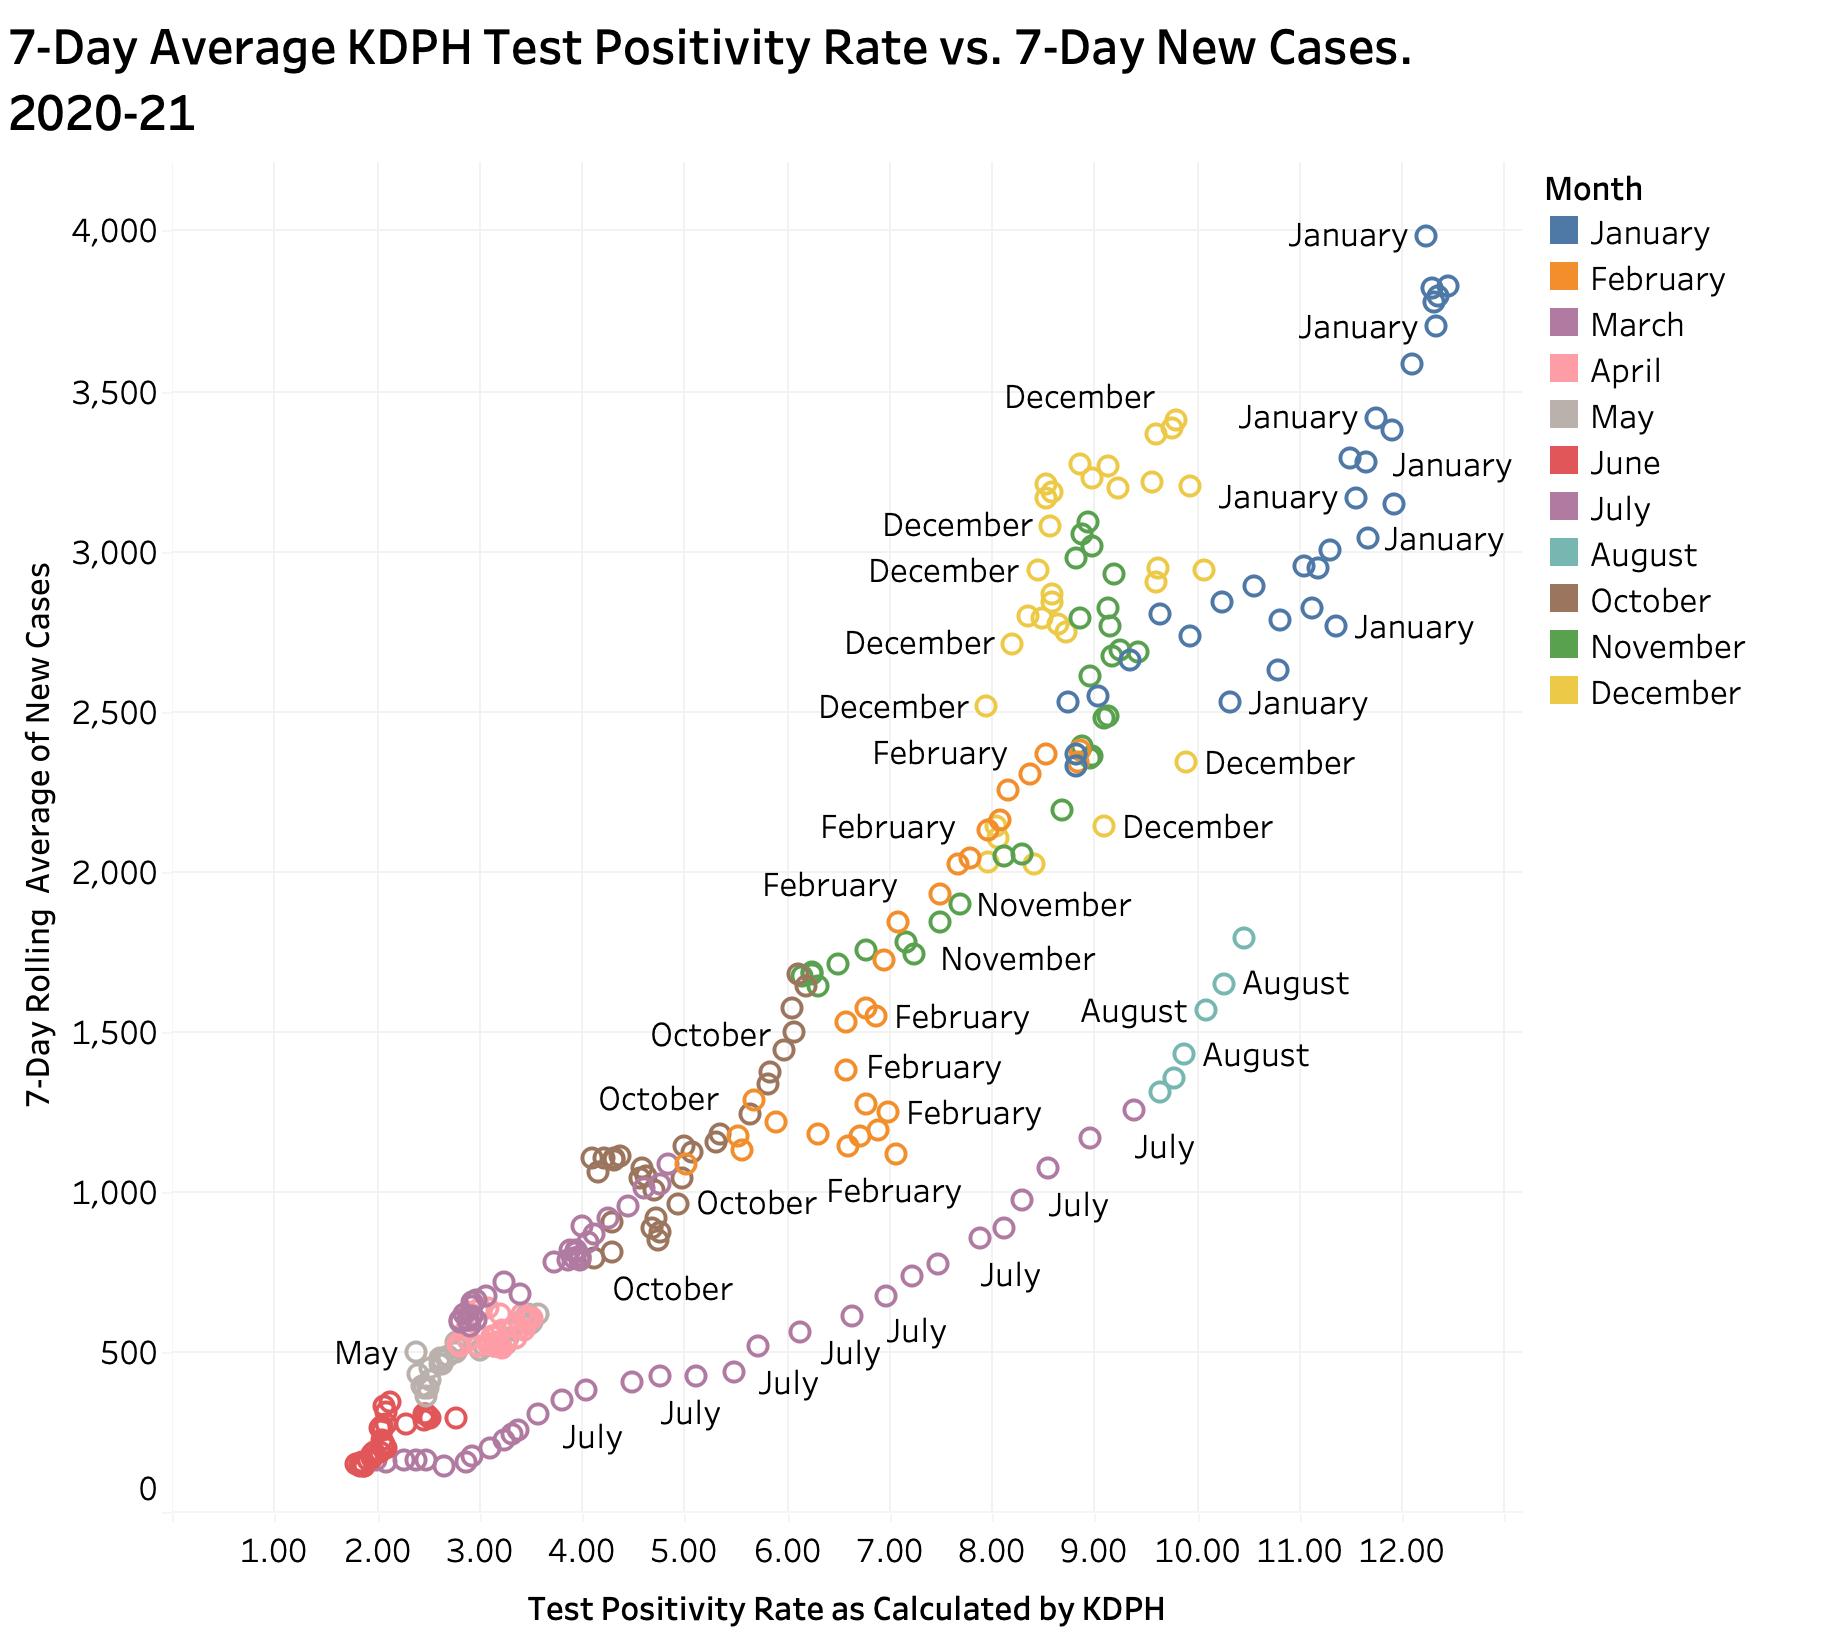
Relationship of 7-Day average new cases to Test Positivity Rates, KY.
Beginning last October, both TPR and new cases rose to their peak values in December and July of 2020-21. By June 2021, the availability of vaccines and at least some adherence to public health measures drove both measures down to the lowest levels of the entire epidemic. We were feeling good about things. Masks came off, people got together, vaccinations stalled, and the Delta variant entered the scene. Much faster than most of us (including me) could imagine, we have in the span of only 6 weeks rocketed back to the worst of our Kentucky epidemic experience.
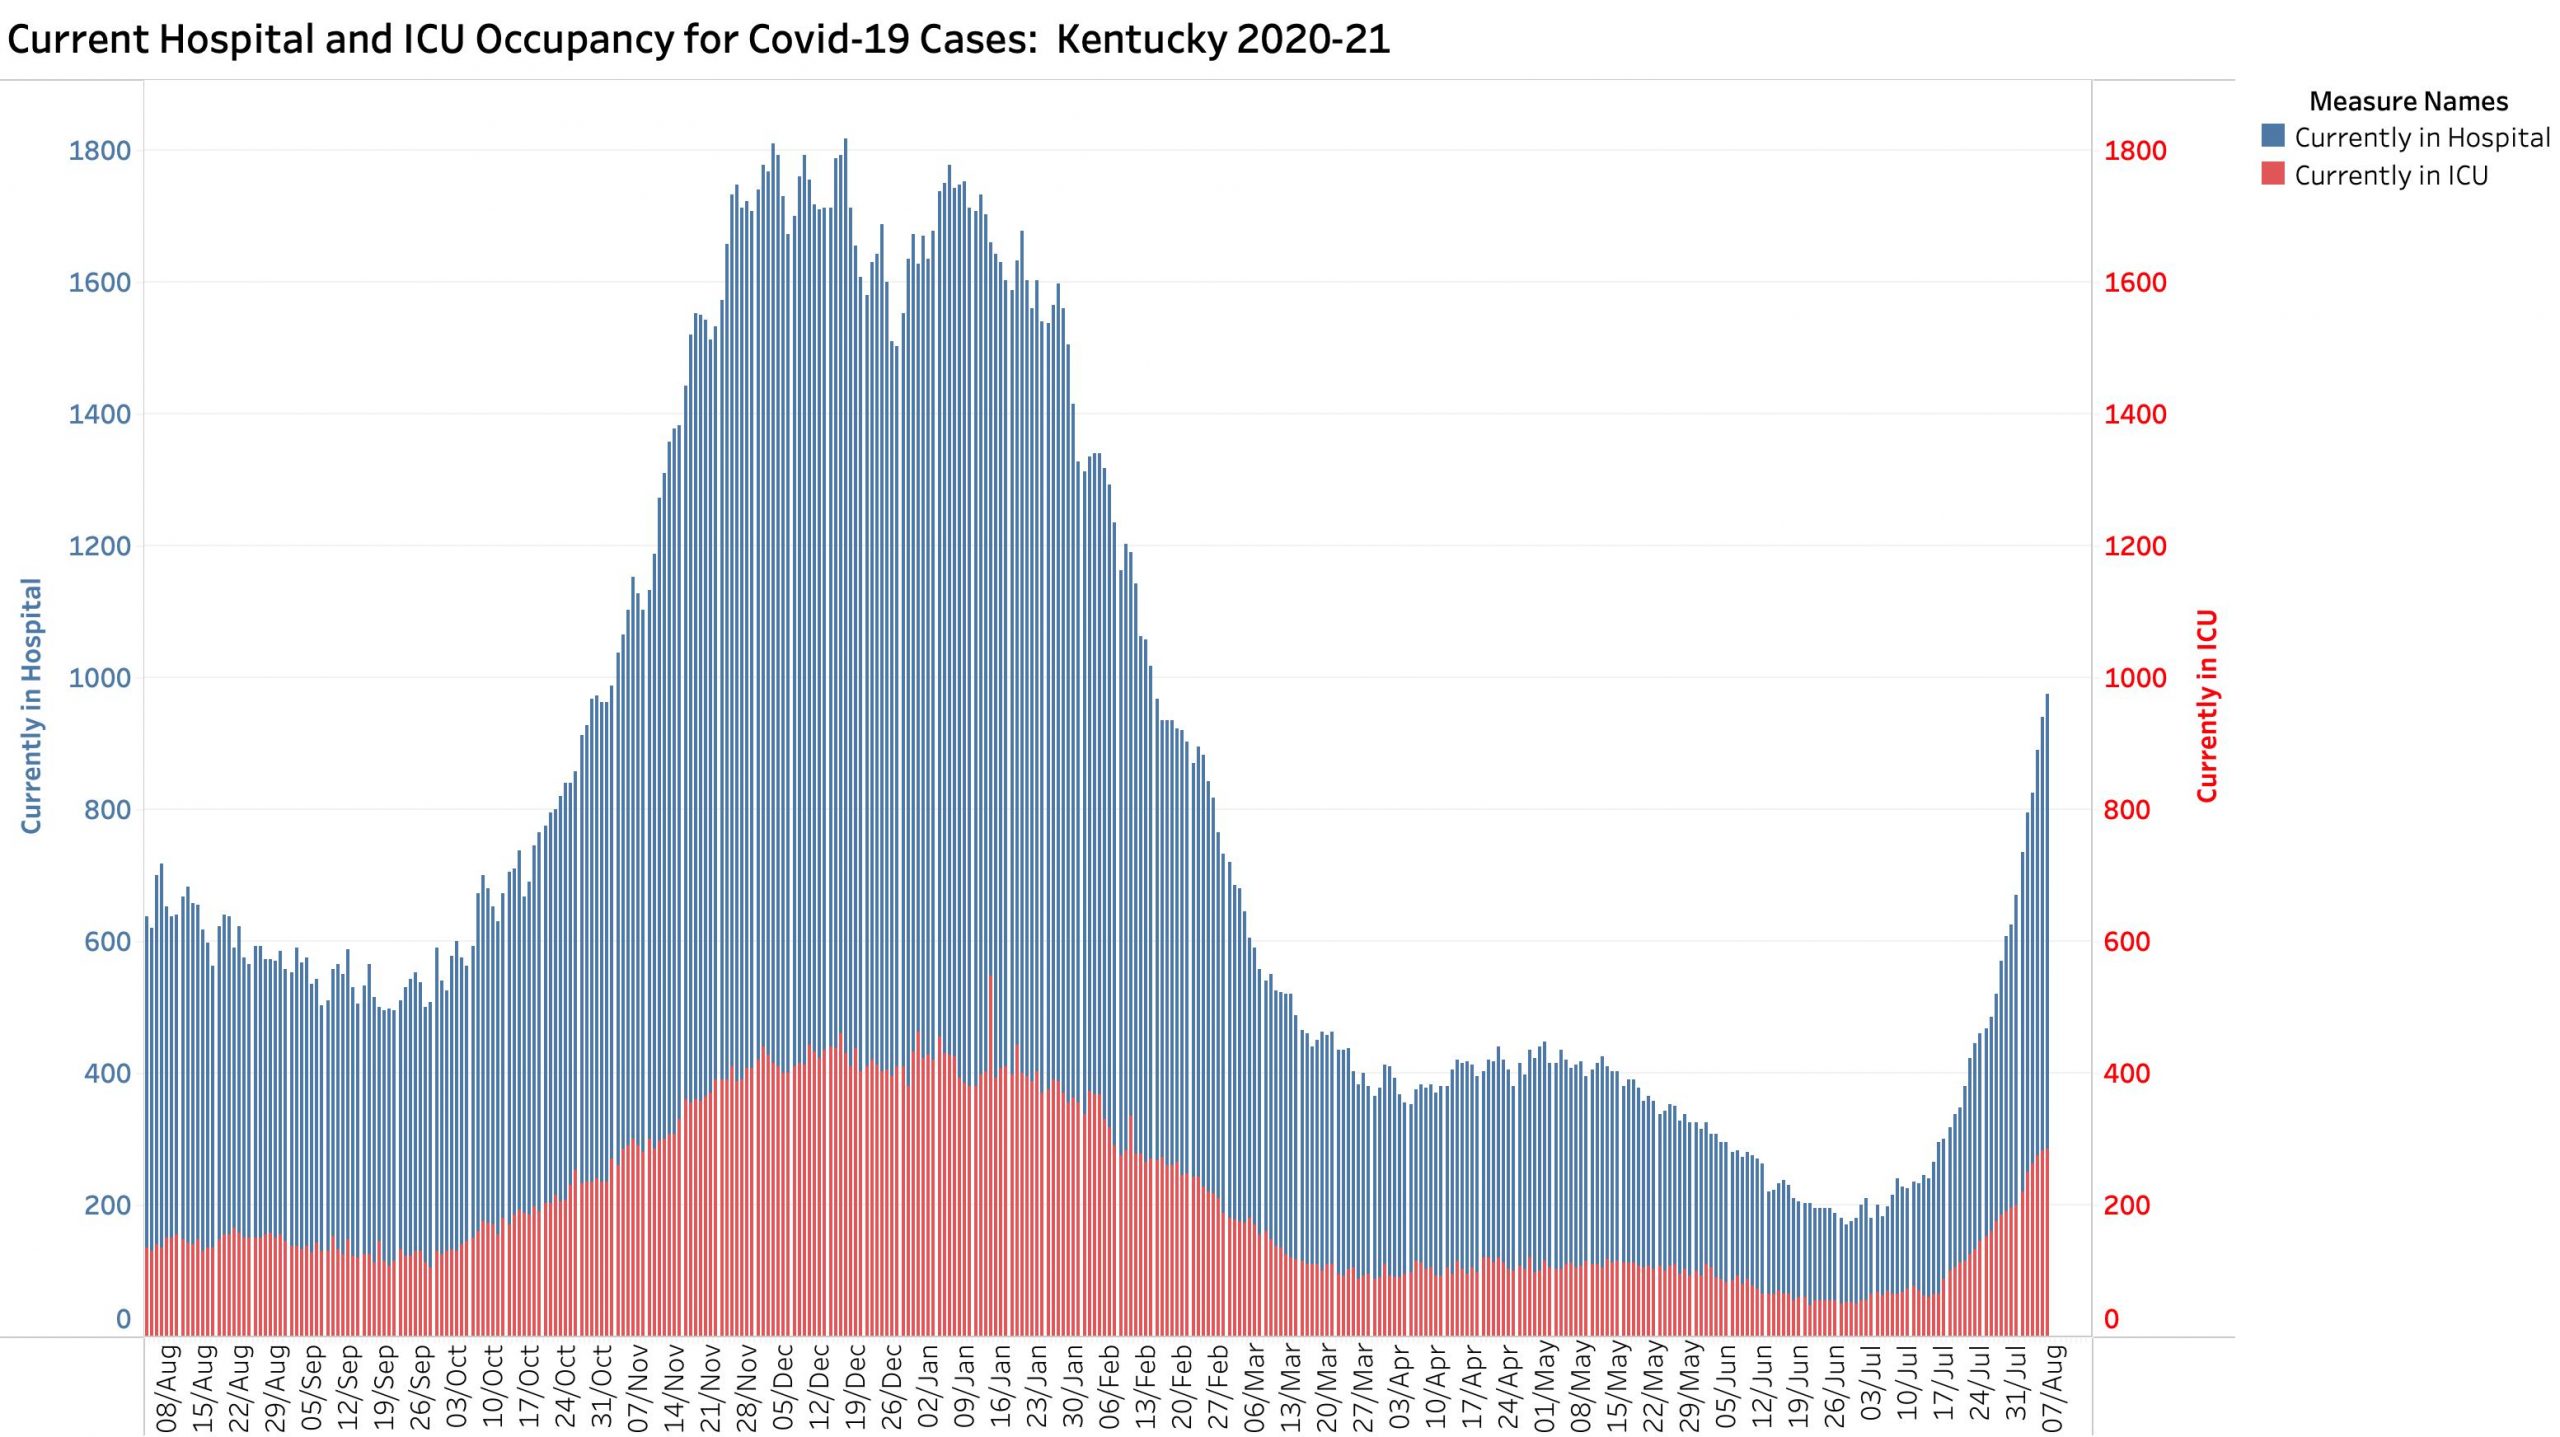
Our hospitals are getting clobbered. The corresponding plot below puts us right back into December-January territory. This is going to hurt!
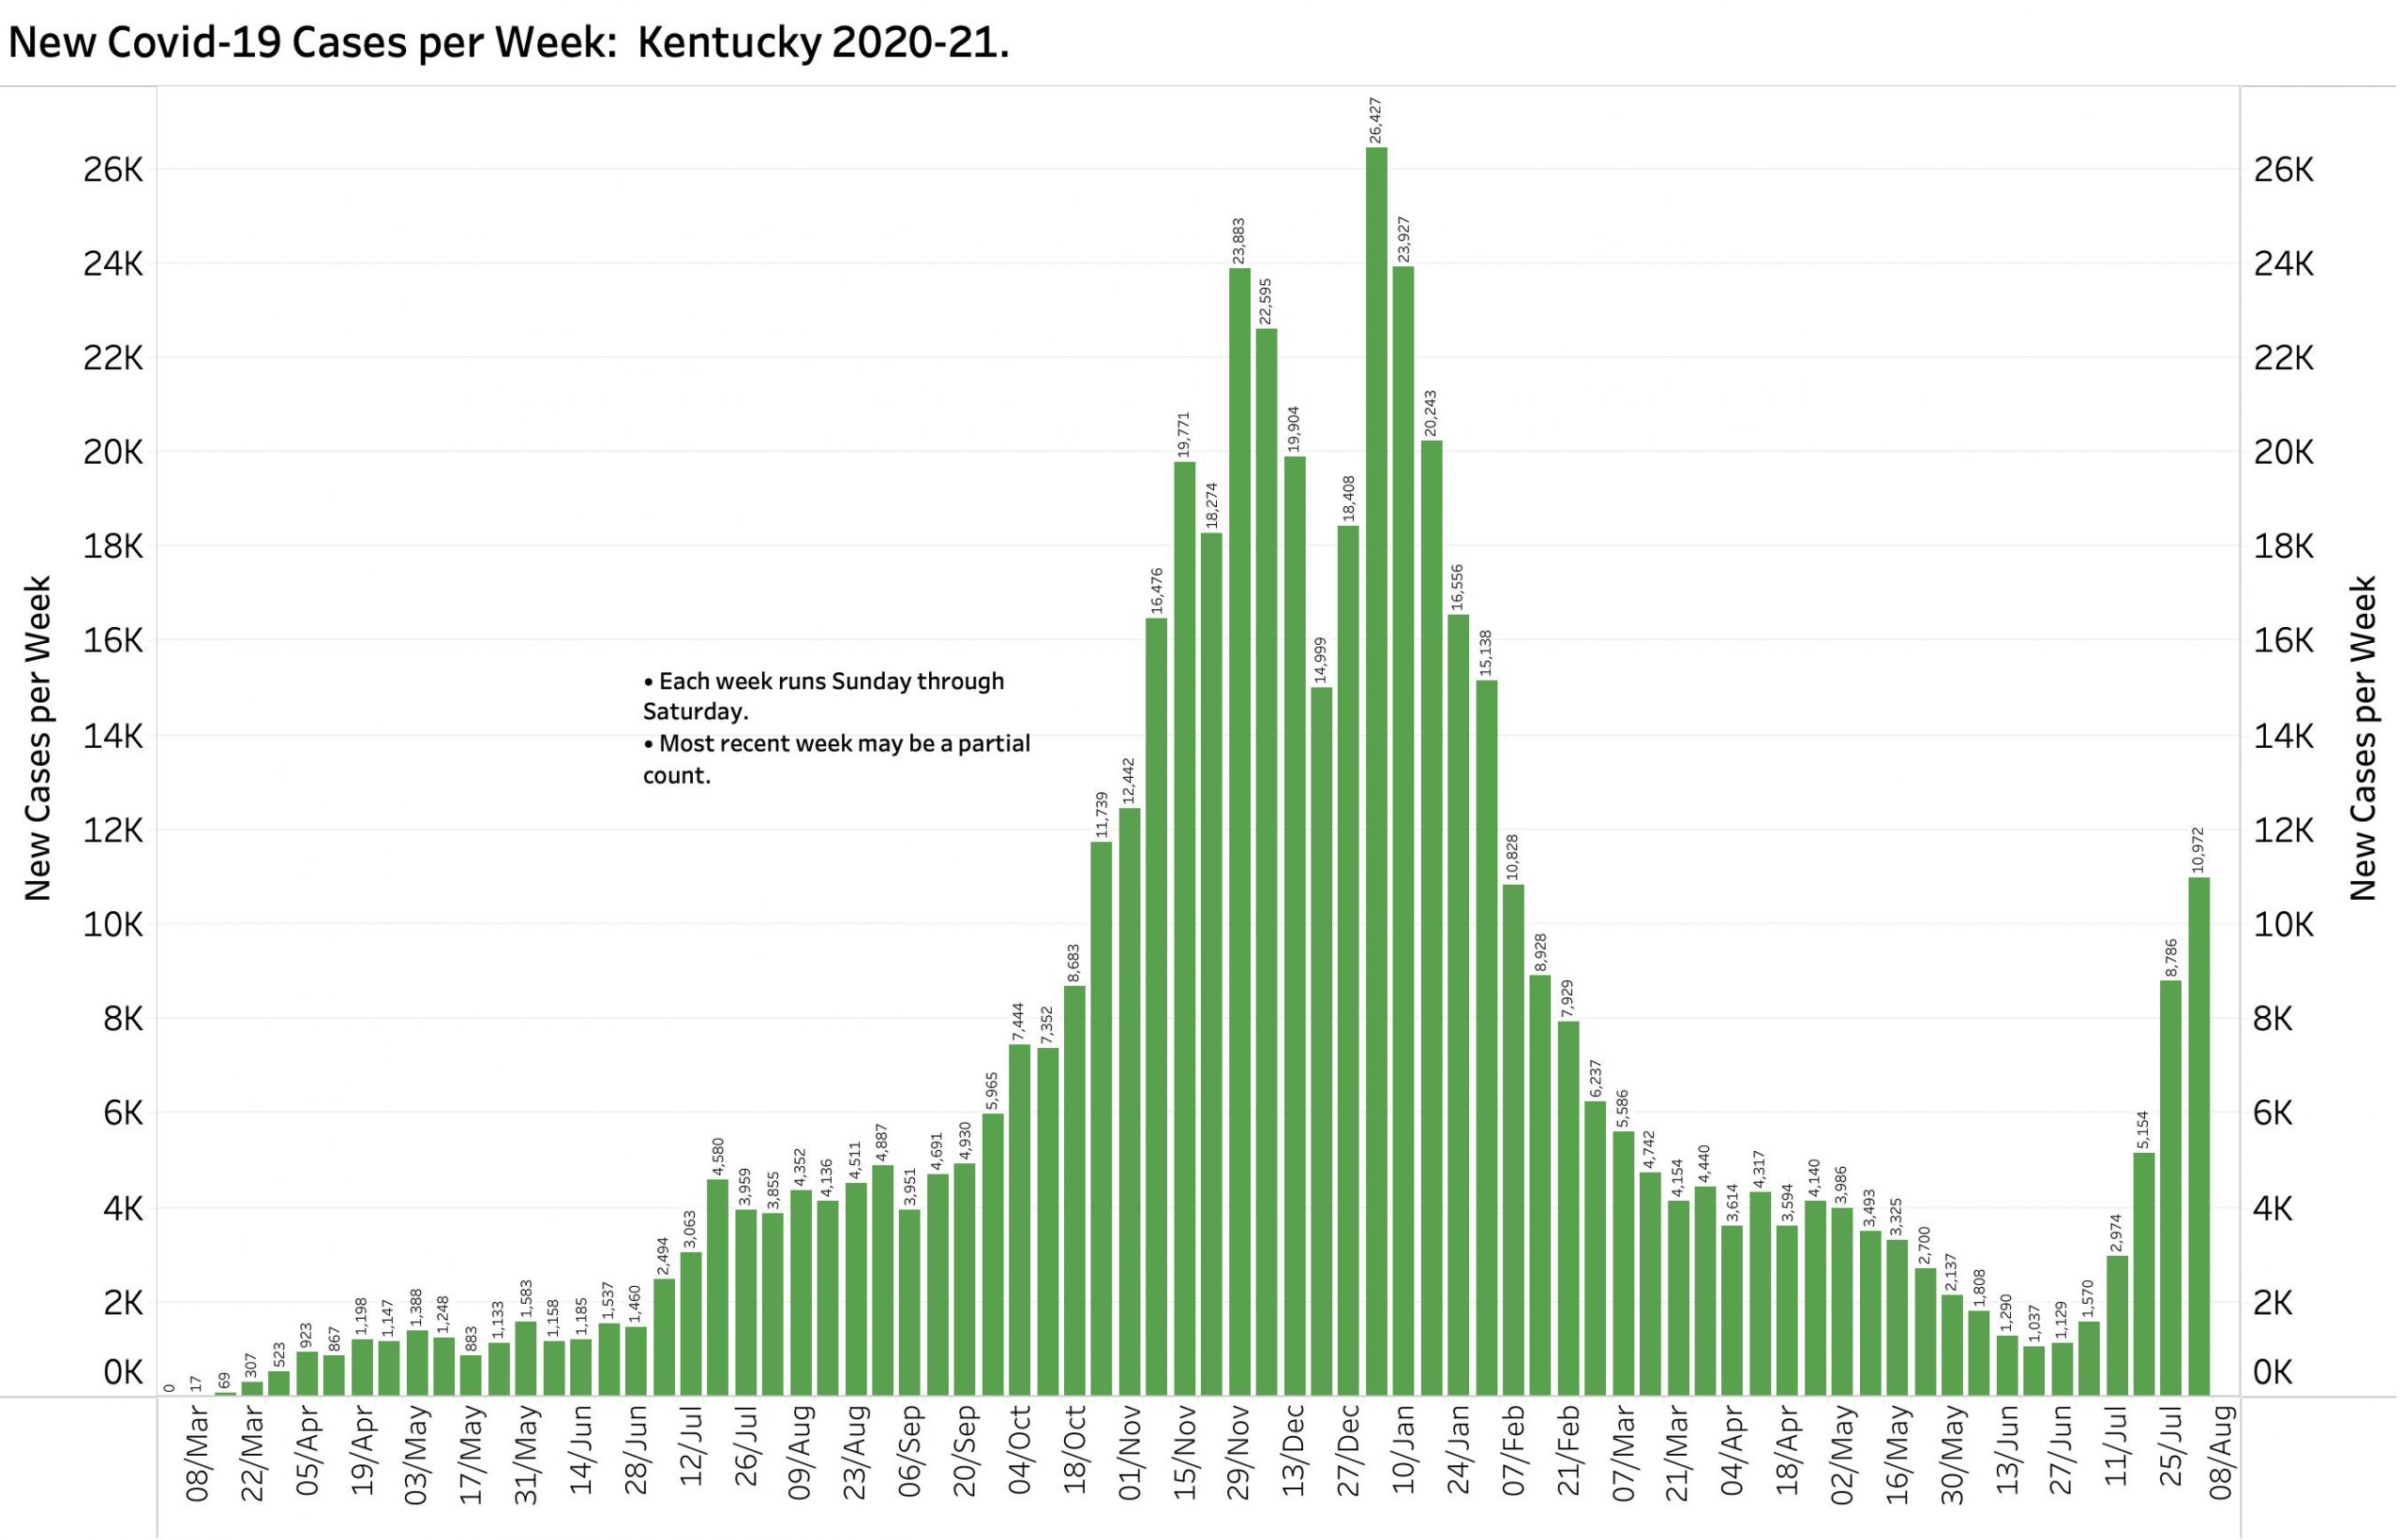
Kentucky’s Covid epidemic, already awful, marches across the state seemingly unchecked. KHPI’s analytic week runs from Saturday to Sunday. Therefore, we will not have today’s case counts or other statistics until next Monday evening. Even so, with 10,972 cases added to aggregate case totals in only a six-day week, Kentucky is already back to our disastrous November of 2020! The same can be said of current hospital utilization and Test Positivity Rates. This explosion of cases is especially dramatic because the current pool of vulnerable Kentuckians is smaller than in November! Vaccination and previous infection/recoveries make new or reinfections much less likely. Indeed, it is said by Public Health authorities here and nationally that the great bulk of new cases are occurring in unvaccinated individuals. At this point in the pandemic, this means we expect to see a larger proportion of children and younger adults getting sick. Such vulnerable folks are well seeded throughout the Commonwealth where non-medicinal public health measures are applied to widely varying degree or not at all!
Some public health and preventative behaviors are changing. More people are getting vaccinated and tested. Ominously however and based on actual new-case counts since July 1, 2021, unless public behaviors or other factors change faster and extent, KHPI projection estimates that Kentucky could hit 5000 new cases daily as early as August 17. I want that to be in error, but earlier KHPI projections over the past year and even the past month have on or near targets.
The reader can view KHPI’s trimmed down portfolio of data visualizations on Tableau Public. Here are a few examples.
Weekly cases Covid-19 in KY. Most recent week of 6 days is incomplete.
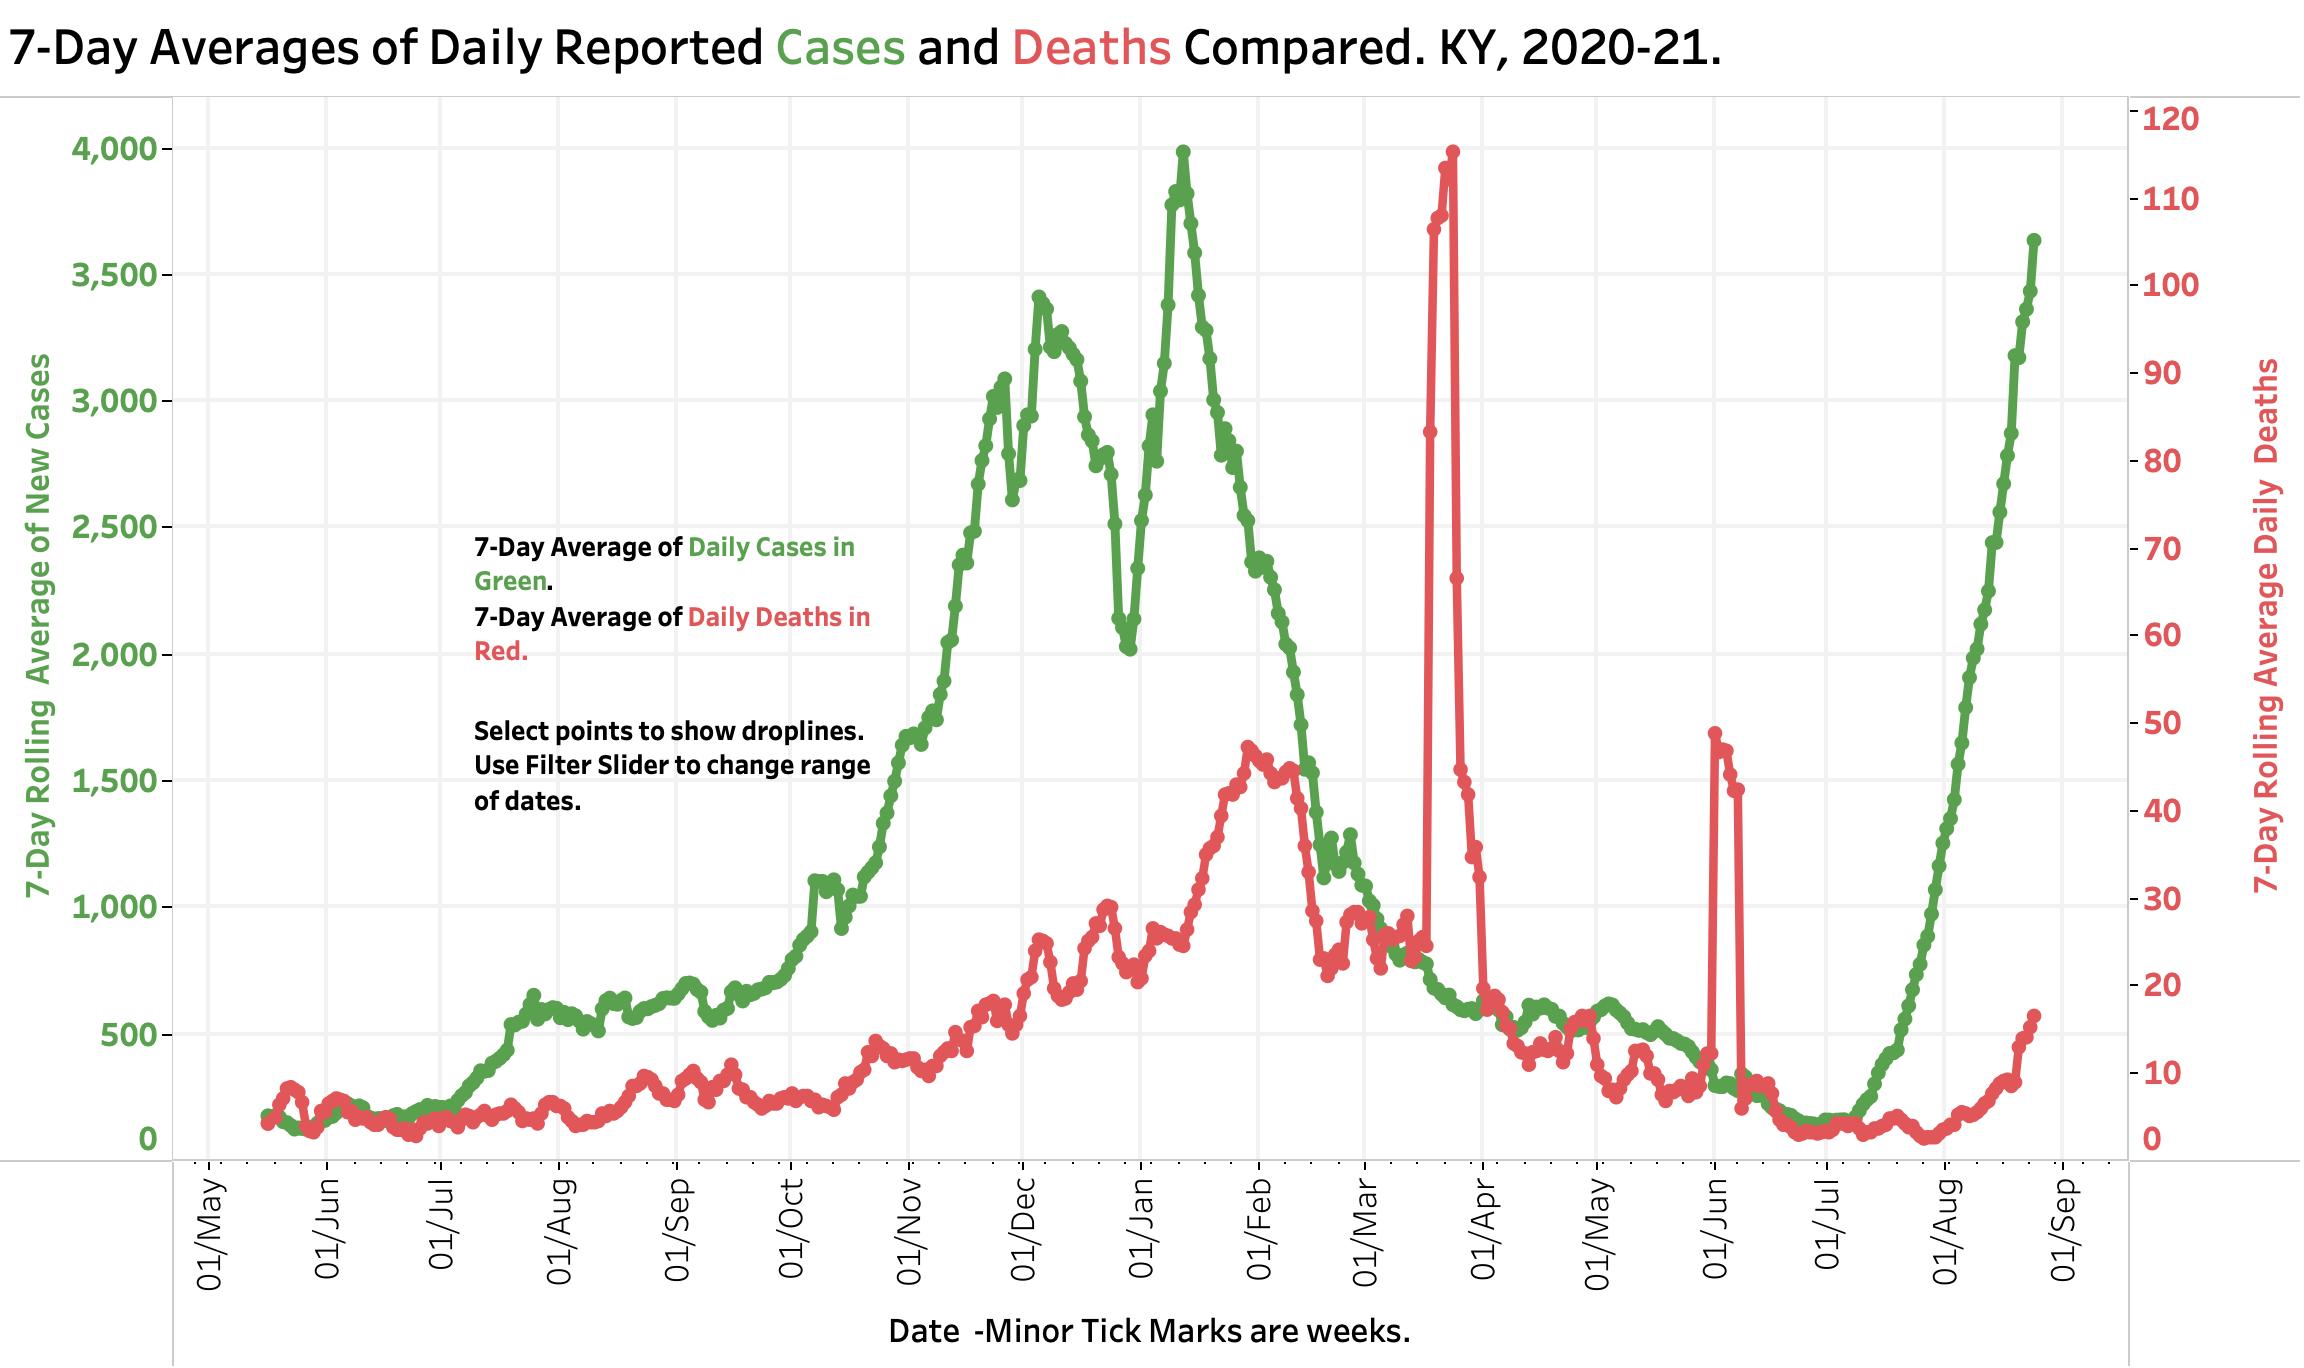
Cases and Deaths. Covid-19 in KY. As of 8-6-21.
Hospital & ICU Utilization. Covid-19 in KY. As of 8-6-21.
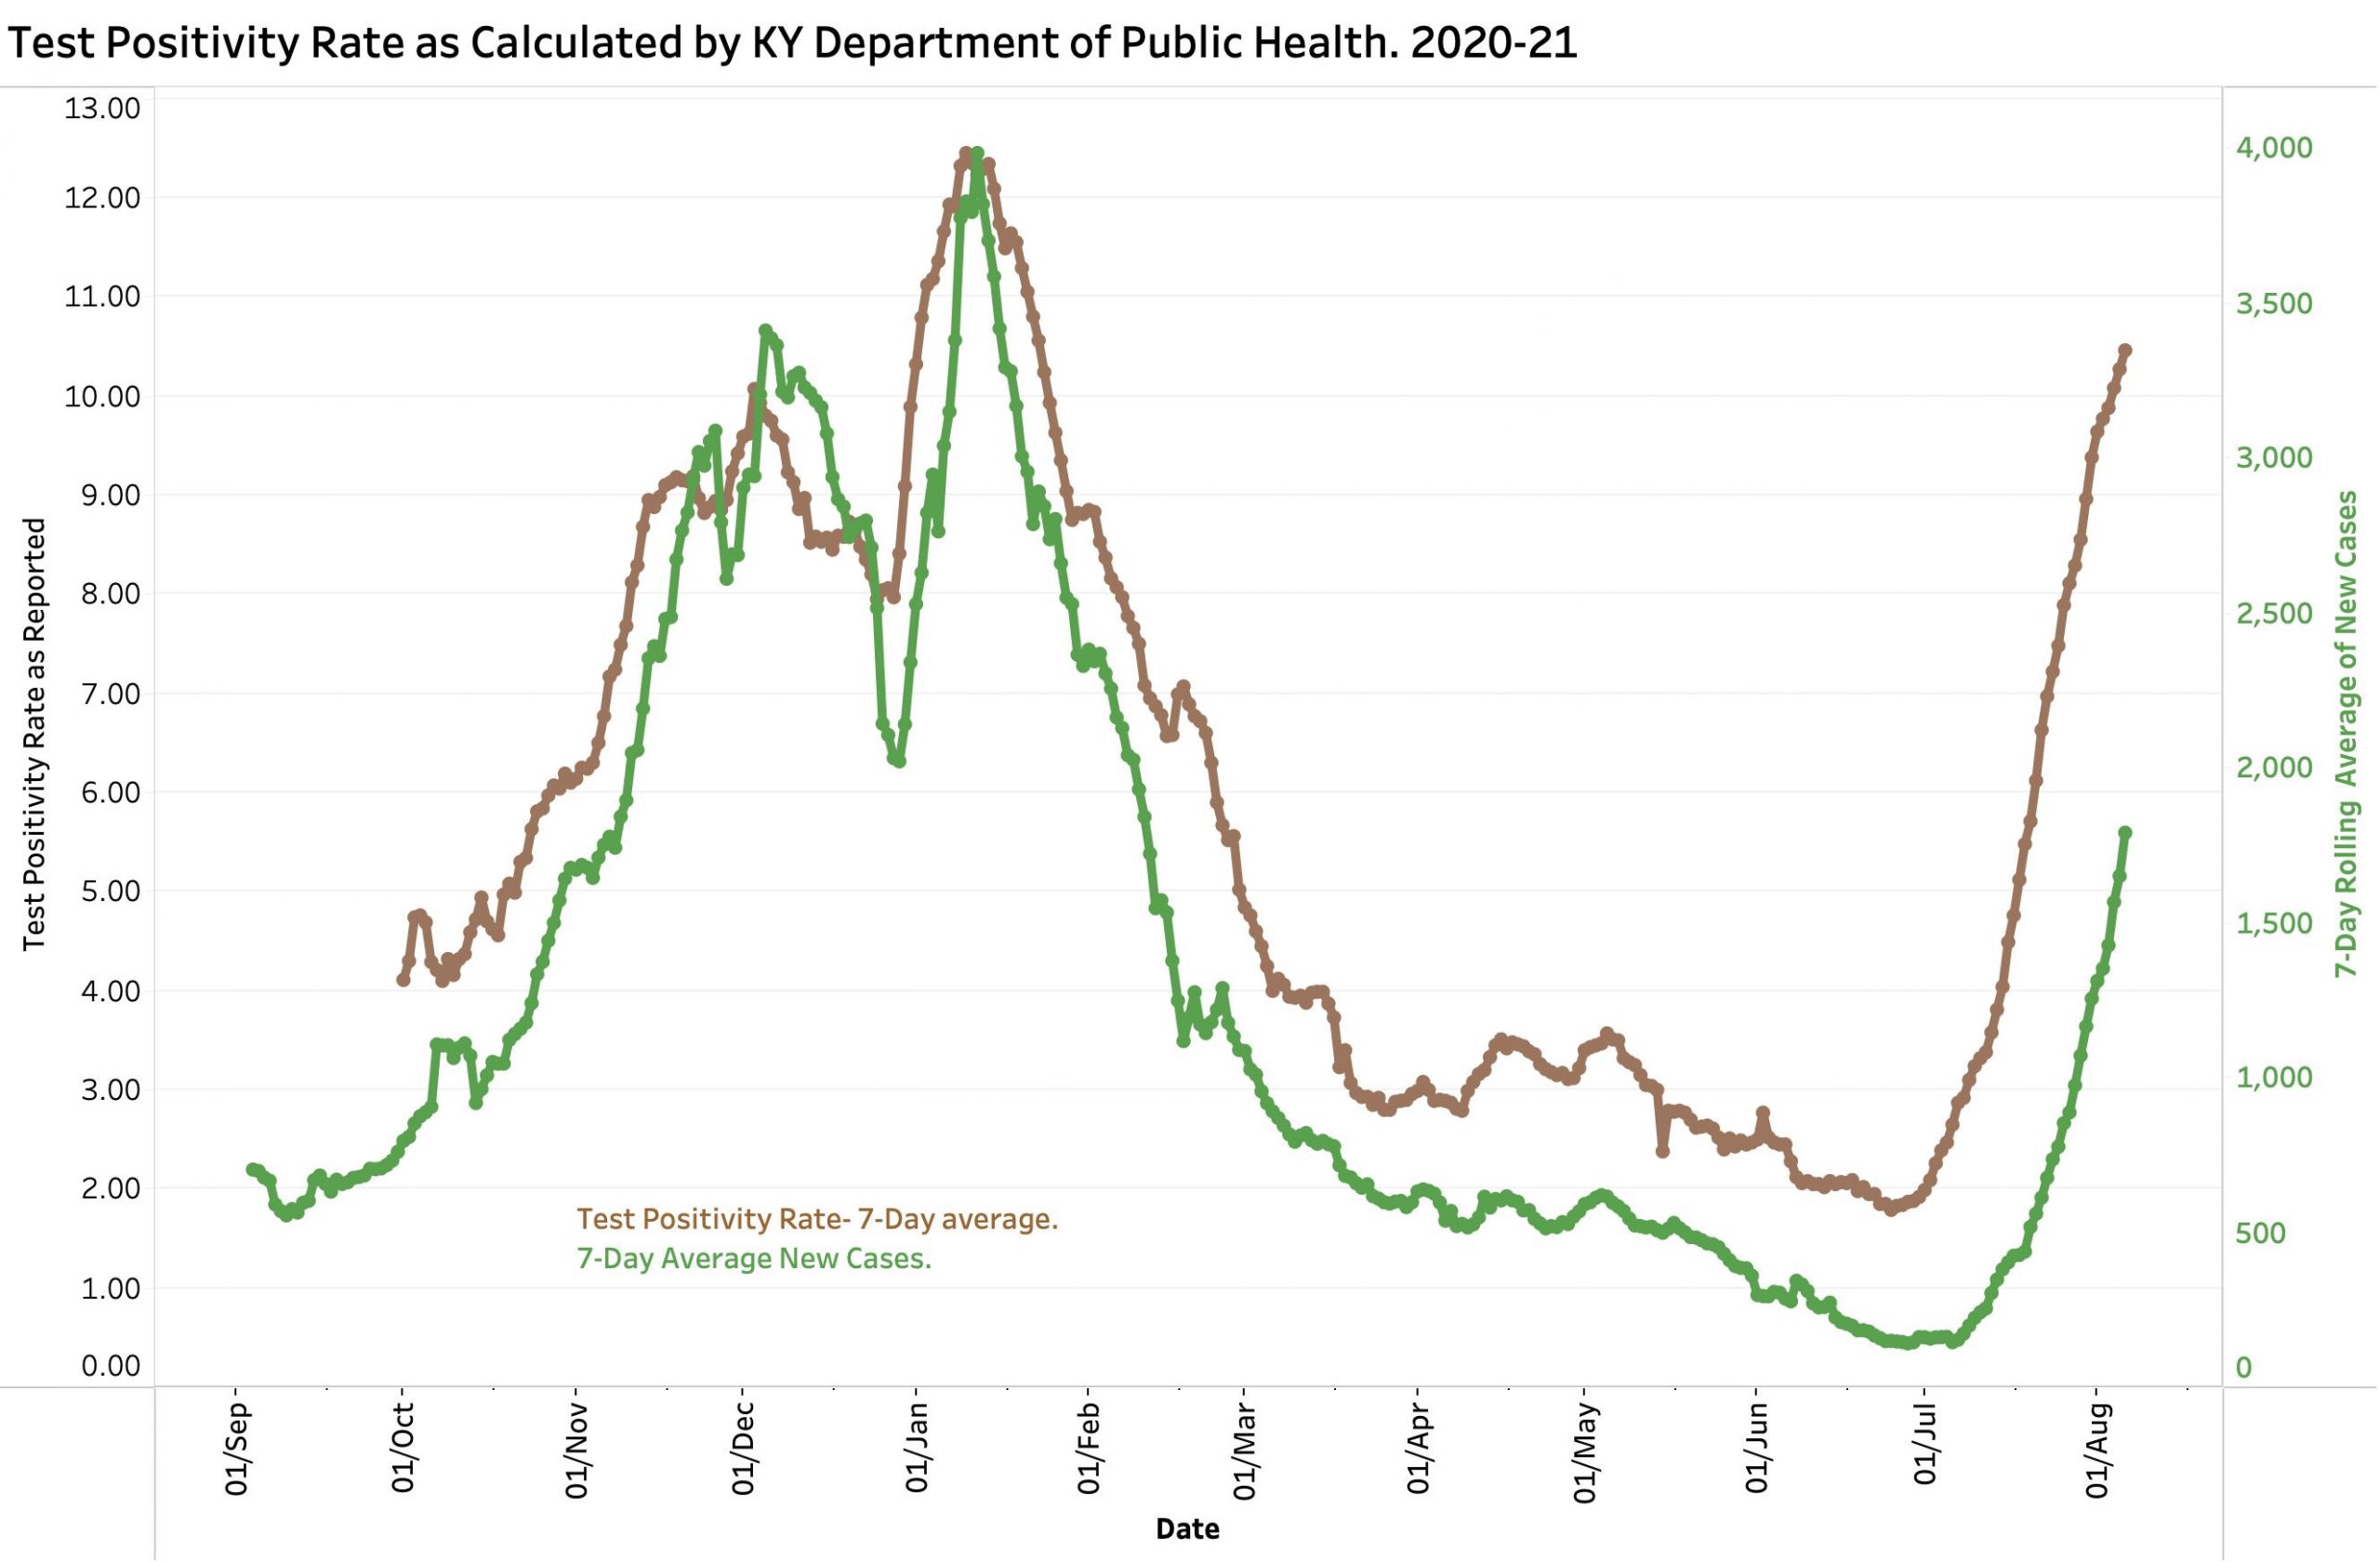
Test Positivity Rate. Covid-19 in KY. As of 8-6-21.
This next visualization displays the relationship of Test Positivity Rate and 7-Day new case rate for each day since October 1, 2021. The string of data points running across the bottom labeled July and August displays the values since July 1, 2021. We are aggressively approaching the same relationships as in January 2021. A companion display shows the relationship between TPR and hospital utilization. (The viewer can see both and adjust the range of dates displayed on the interactive Tableau Public website.)
Test Positivity Rate & 7-Day Case average and Covid-19 in KY. 10-1-20 to 8-6-21.
I have little more to offer this Saturday morning. Get vaccinated as soon as possible. Wear masks whenever abound other people you do not live with, especially when you do not know of their vaccination status. Avoid situations where there are a lot of people either inside or out. Listen to Governor Beshear and Doctors Stack and Fauci. Support and protect people and entities who are doing the hard things asked of them. This includes our hospitals and healthcare workers who are getting both swamped and burned out. Why wait until things get even worse?
Peter Hasselbacher, MD Emeritus Professor of Medicine, UofL President, KHPI Saturday, 7 August 2021