What if Kentucky’s New Covid-19 Cases Increase at the Current Exponential Rate?

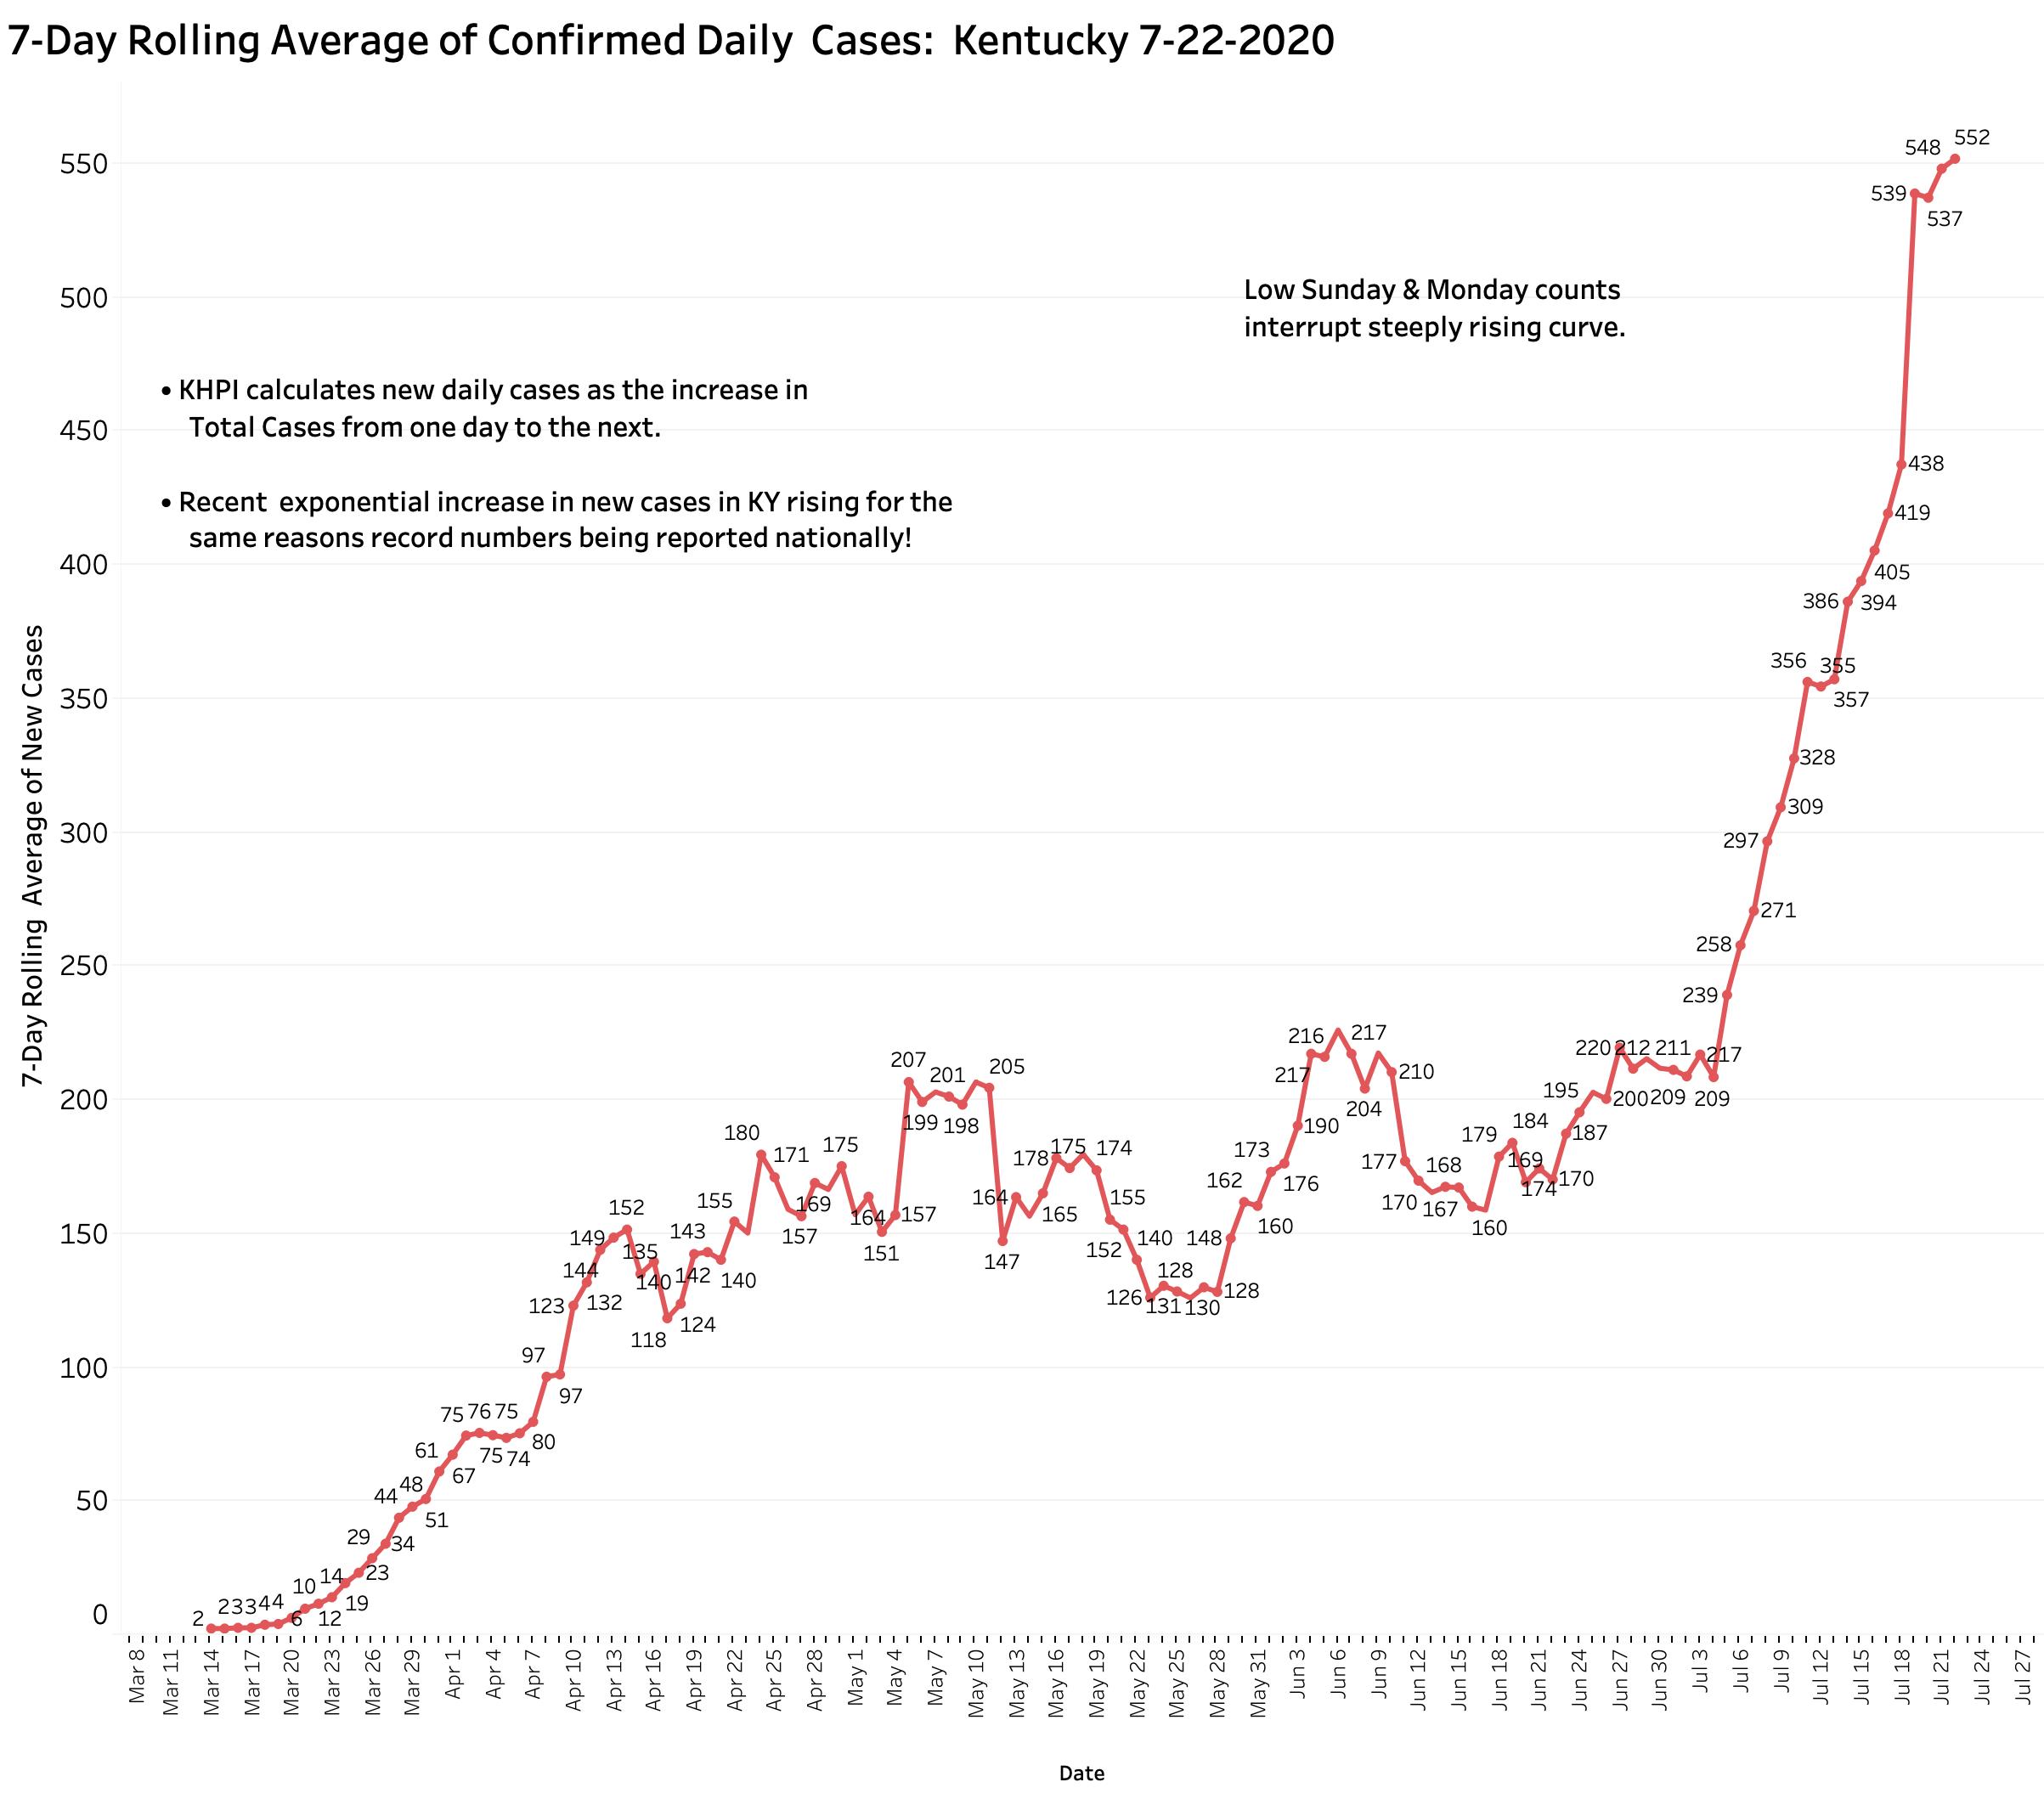
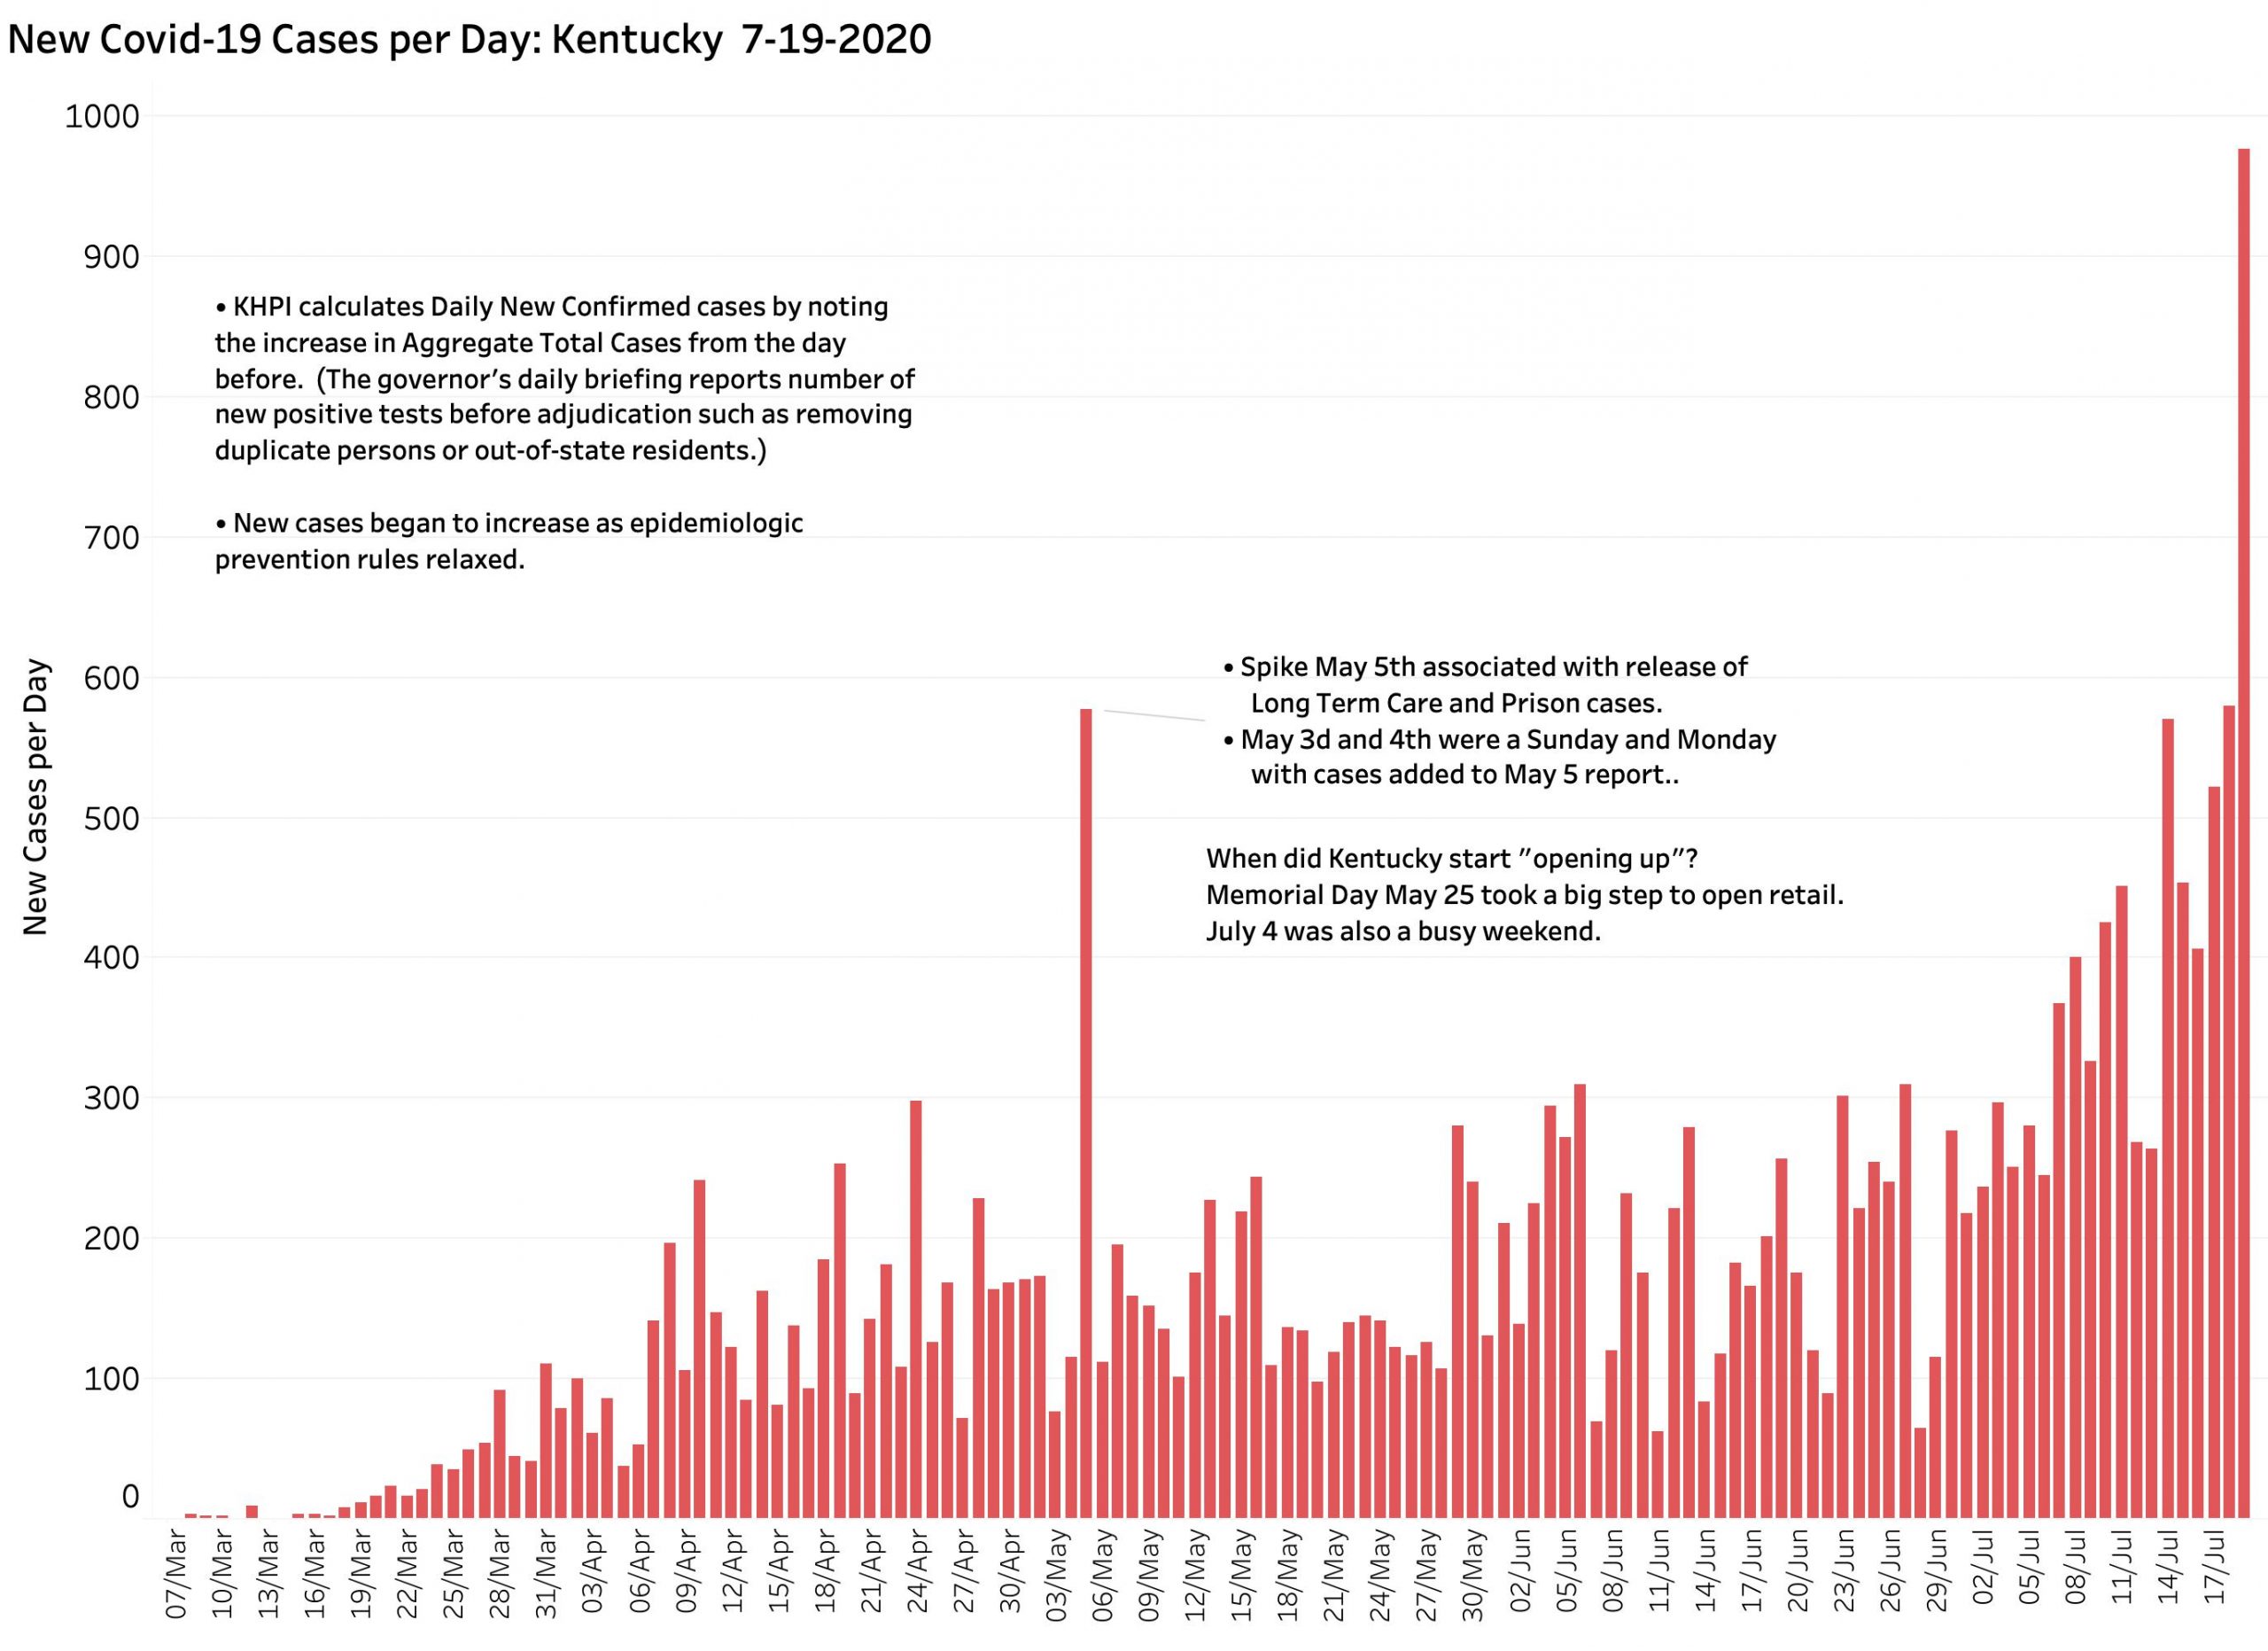
Yesterday’s (Wednesday) evening Covid-19 update from Frankfort told of 518 new cases but from which there were an unusually high number of 38 removed as duplicates or perhaps for other reasons. KHPI reports new cases as the day-to-day difference in total cases which yields a smaller number of 480 additional new cases. This number, while higher than any new case number earlier than July 7, is less than the several 500s, 646, or 977 counts of the previous 7 days. The rise in the 7-Day average to a new high of 552 was at least temporarily blunted– but it has not begun to fall either. Time will tell us in which direction our case trend is headed. It has only been since July 9 that mandatory mask use was required in Kentucky, but its implementation was challenged in the courts and compliance has been spotty in any event. I suspect it is too early to expect a major effect on spread at this early time. End-of-week Fridays and Saturdays have historically given us higher counts in the past. The monstrously high count of 977 was reported just last Sunday. Three reporting days of the week remain just ahead of us.

[Addendum 7-24-20: Yesterday evening’s data report confirmed ongoing rapid expansion of the epidemic. KHPI noted 607 additions to total cases and 7 new deaths. With two days to go in this calendar week, the number of new cases is already nearly as many as last week. Based on the current rate of increase of the 7-Day average, new cases are doubling by at least every 12-13 days. Hospital and ICU utilization continue to trend upwards. In all this, Kentucky is mirroring the nation overall. We are all in trouble! The full panel of visualizations on-line have been updated.]

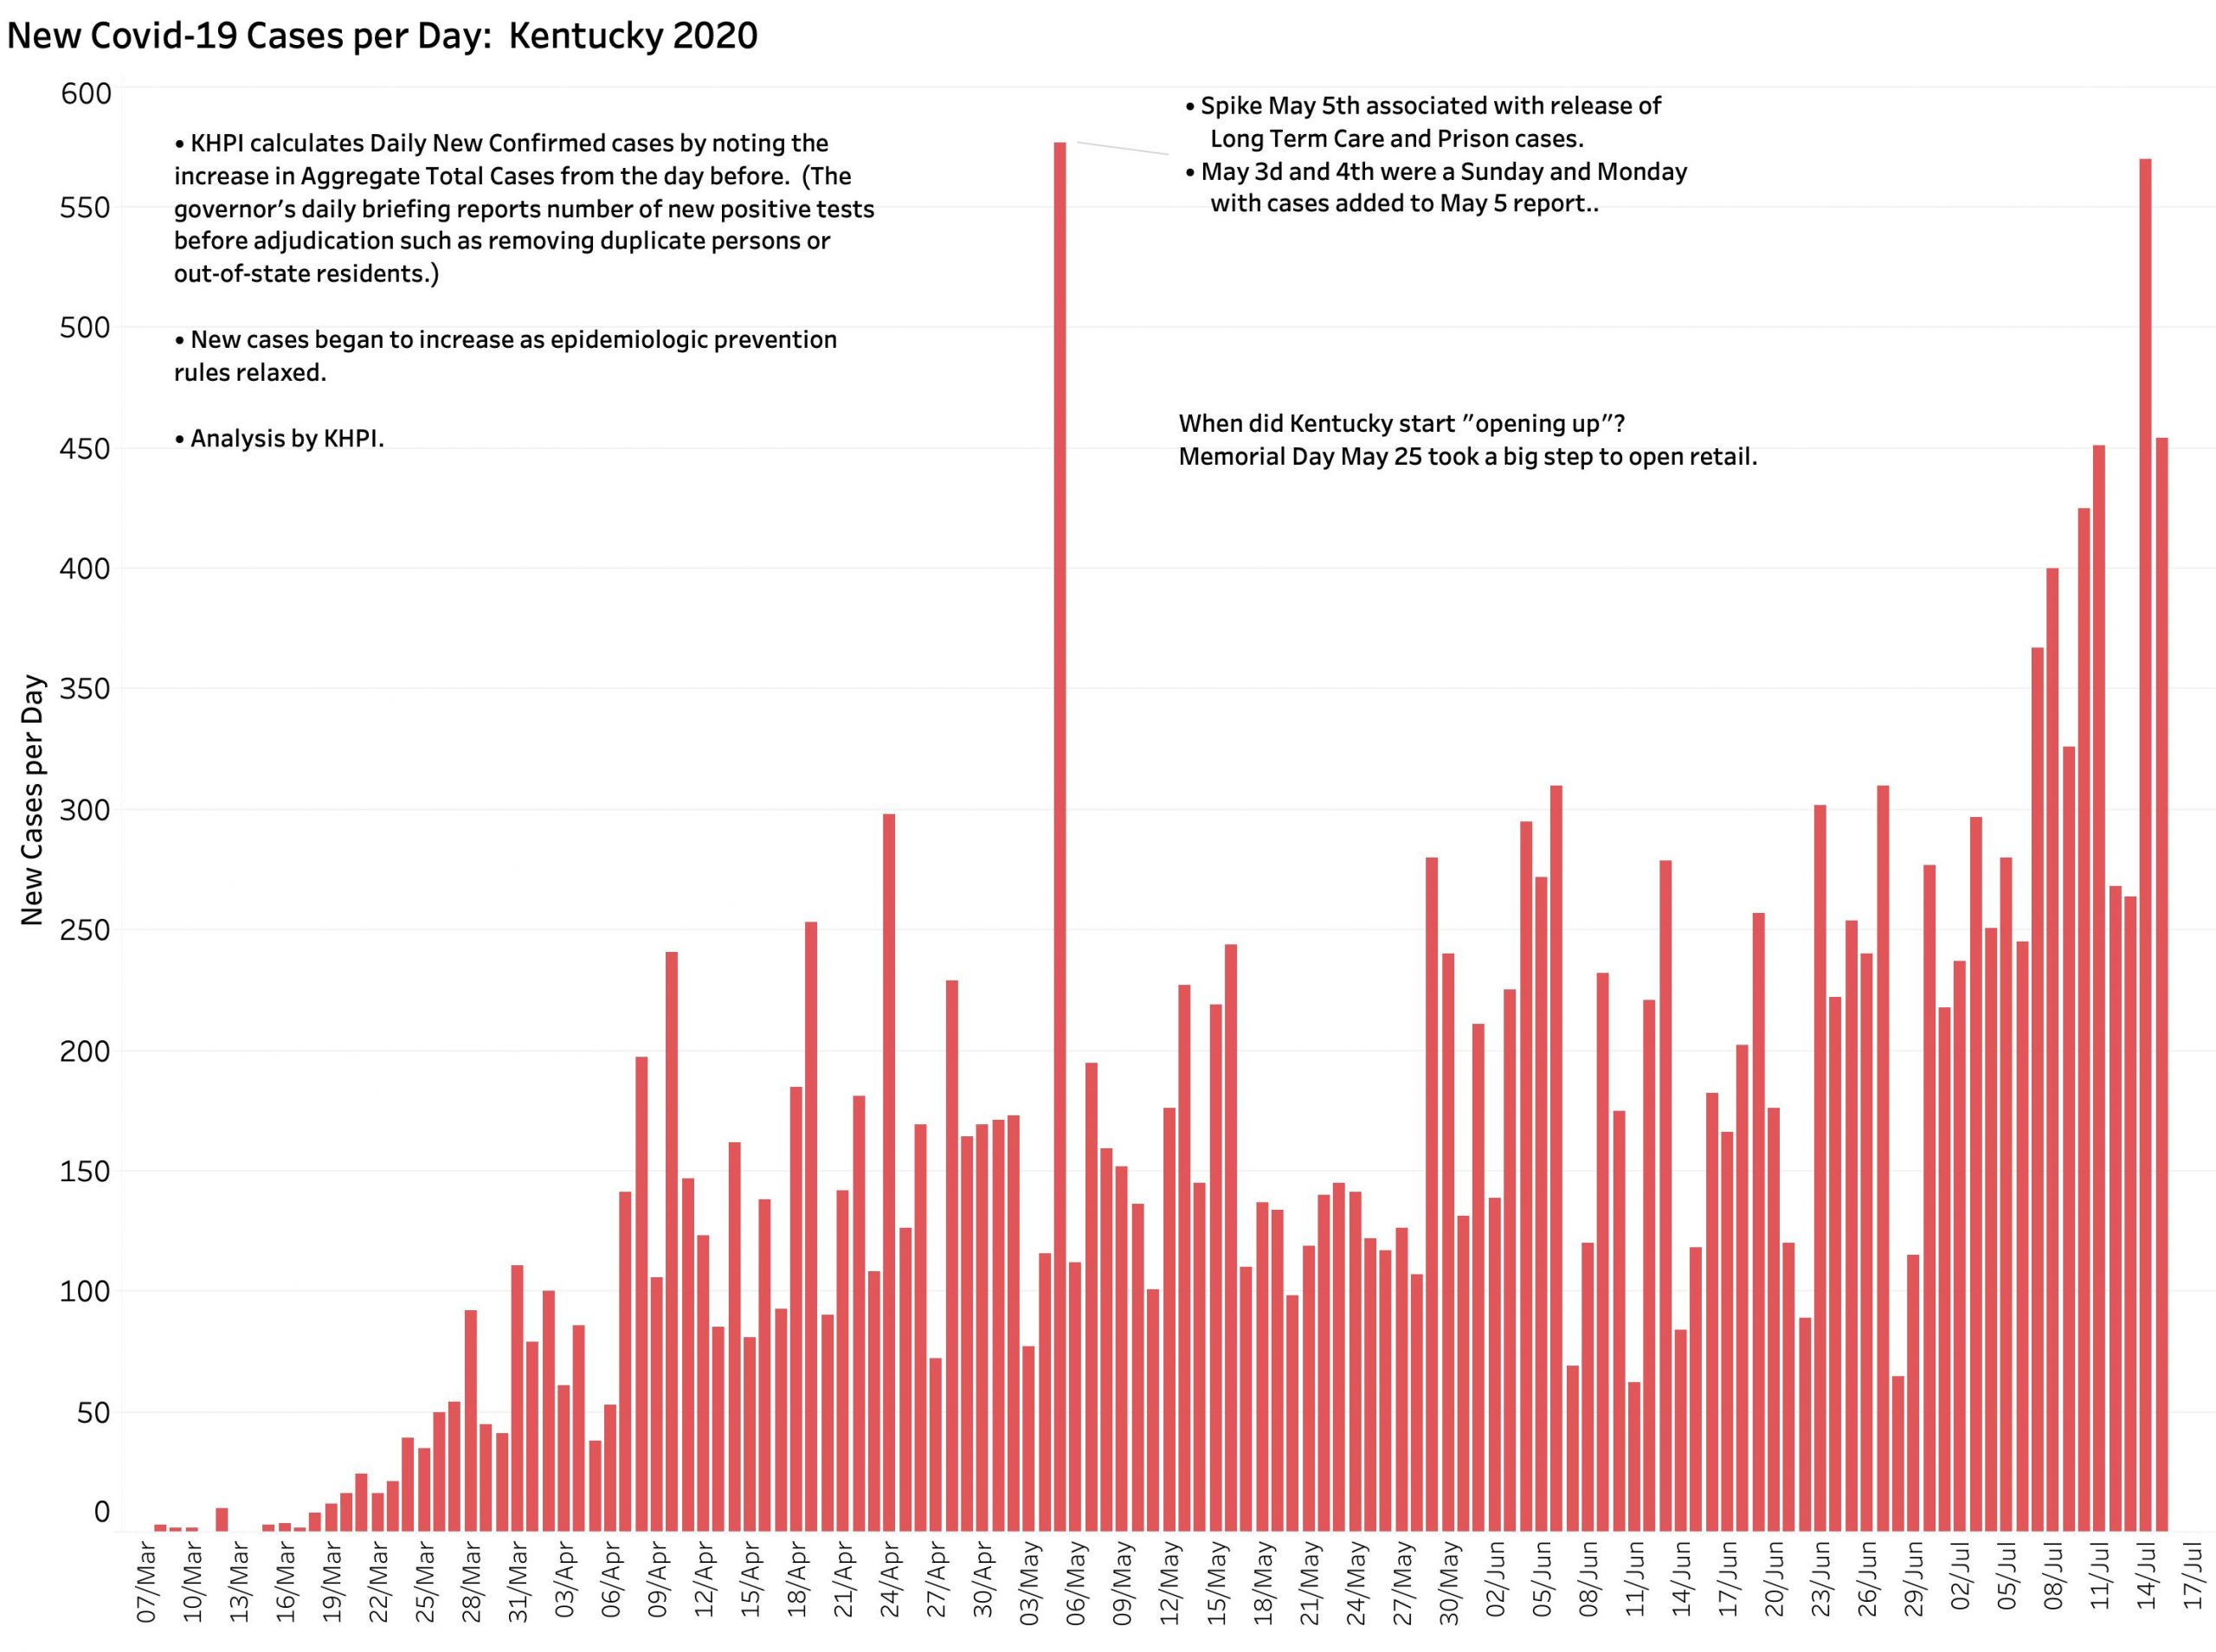
[Addendum 7-24 4:30 pm: todays new case reports adds 744 to the total. This is bad news. Even without Saturday’s report tomorrow, the number of new cases has jumped well ahead of last weeks total. At this rate, unless something changes or happens, we will be at 1000 cases per day by August 3d. Deaths in today’s report added 7 new ones. I will elaborate on the weeks finding s tomorrow evening. I place an updated graphic of 7-Day New Cases at the end of this article.]

7-Day rolling average of new cases as of 7-22-20
Continue reading “What if Kentucky’s New Covid-19 Cases Increase at the Current Exponential Rate?”

Covid-19 in Kentucky. The Bad News Gets Even Worse.

At the time of my last article on July 16, I reported the record-breaking rise in new Coronavirus cases in Kentucky. That was on a Tuesday. I amended the article twice to show that the epidemic surge was no illusion. Indeed, over the weekend the curve of new cases continued to go nearly straight up in a clear exponential manner. Yesterday’s (Monday) new case count leapfrogged over any previous high to 977. Kentucky has the dubious distinction this morning to be listed by the New York Times as among the very top states with the most rapidly increasing number of Covid-19 cases. This is not something for which recognition is desirable!

Technical note:
For these initiatives, I have been calculating daily new cases as the increase in Total New Cases from the Total of the previous day. This number is usually a few below what the Governor’s report terms “New Cases.” I understand that latter group includes duplicates, out of state cases, corrections, or perhaps other exceptions that do not ultimately show up in the Total (aggregate) Cases. This likely source of confusion can be seen in the data of the national data aggregators and probably in the data of the CDC. I did not want to include duplicates and my efforts to obtain better data from Frankfort have not been successful. The differences between KHPI’s counts of new cases and Frankfort’s are small and the shape of the curves remains essentially identical.

I have been updating the on-line interactive versions daily on KHPI’s Public Tableau website. I began this series of articles in part as a self-educational project to explore how emerging epidemiological data could be usefully portrayed and used to monitor how and where our public health efforts were succeeding (or not) in a timely way. The result was a larger number of visualizations than most readers might want to see. beginning today, I trimmed out a number of graphics that seemed less useful at this stage of the epidemic. I place below a few of the graphics that include yesterday’s new, and indeed frightening case numbers. The new link link just above opens the most up-to-date interactive versions of all the data and visualizations.

Here is a traditional Bar Chart of the number of new cases per day current up to yesterday, July 19. Click on it to enlarge in a separate screen.

Continue reading “Covid-19 in Kentucky. The Bad News Gets Even Worse.”

Cases of New Covid-19 Infection in Kentucky Soar to New Daily Records.

New cases of Covid-19 infection in Kentucky are rising dramatically and there is no way to explain away the reasons as anything less than a demonization of medical science, and a destructive politicization of public health policy. I fear that after 4 months of difficult sacrifice, we are going to have to start all over again.

The total number of new of new Kentucky Covid-19 infections jumped by 570 and 454 over the last two days. Today’s report will be available soon. The seven highest daily reports of the epidemic have occurred since July 1. Although there were 577 cases reported on Tuesday, May 5, this obviously aberrant number included a large cache of previously uncounted cases in a prison, and from several long-term care facilities. That day’s report also included catch-up cases from the immediately preceding Sunday and Monday– intrinsic low reporting days. We are in new territory.

When did the current surge begin?
Because of our multiple catch-as-catch-can reporting systems nationally and in Kentucky, it is hard to tell. Because it was marked in my mind with a rapid change in public behaviors when retail stores and restaurants opened, I believe our local expansion began with May 25 Memorial Day weekend. After all, national and some local political leaders were telling us it was safe to do more. Indeed, some political and other leaders were telling us to frankly ignore what actual public health experts were advising. (There is still a lot of that going around.)

Continue reading “Cases of New Covid-19 Infection in Kentucky Soar to New Daily Records.”

Can We Detect Local COVID-19 Surges in Time Do Anything About It?

What happens in Myrtle Beach does not stay in Myrtle Beach!

When I last wrote in these pages on June 8, Memorial Day was two weeks behind us, and retail stores and other public venues in Kentucky had recently taken an intermediate step opening up to the general public. Parking lots, roads, and sidewalks were noticeably more populated. Masks appeared to be optional. Perhaps and probably not coincidently, by June 6 both new daily-reported cases (310) and 7-Day rolling average of new cases (226) hit all-time highs for Kentucky’s part of the epidemic! This change was large enough that the New York Times included Kentucky in its daily tally of states in which the numbers of new cases were increasing fastest. Over the next 2 weeks or so, our state was regrouped by the Times with states whose numbers were decreasing, and then back into the group with “mostly the same” number of new cases. Yesterday we were back in the “increasing” cohort along with 31 other states. In only 6 states or territories were cases decreasing. This considerable volatility in case reports does not inspire confidence that our system of timely epidemiological monitoring or control is adequate. New cases are exploding across the nation. Current Kentucky numbers are rising as well. The following graphic tracks the 7-Day rolling average of new cases in Kentucky and an estimate of the Basic Reproductive Rate as of June 27, 2020. An assortment of other visualizations are presented at the end of this article. Interactive online versions of the complete portfolio of visualizations are available at the KHPI Public Tableau website.

Continue reading “Can We Detect Local COVID-19 Surges in Time Do Anything About It?”