Another Bad Week in Kentucky’s Covid-19 Epidemic Compounded by a Major Reporting Failure.

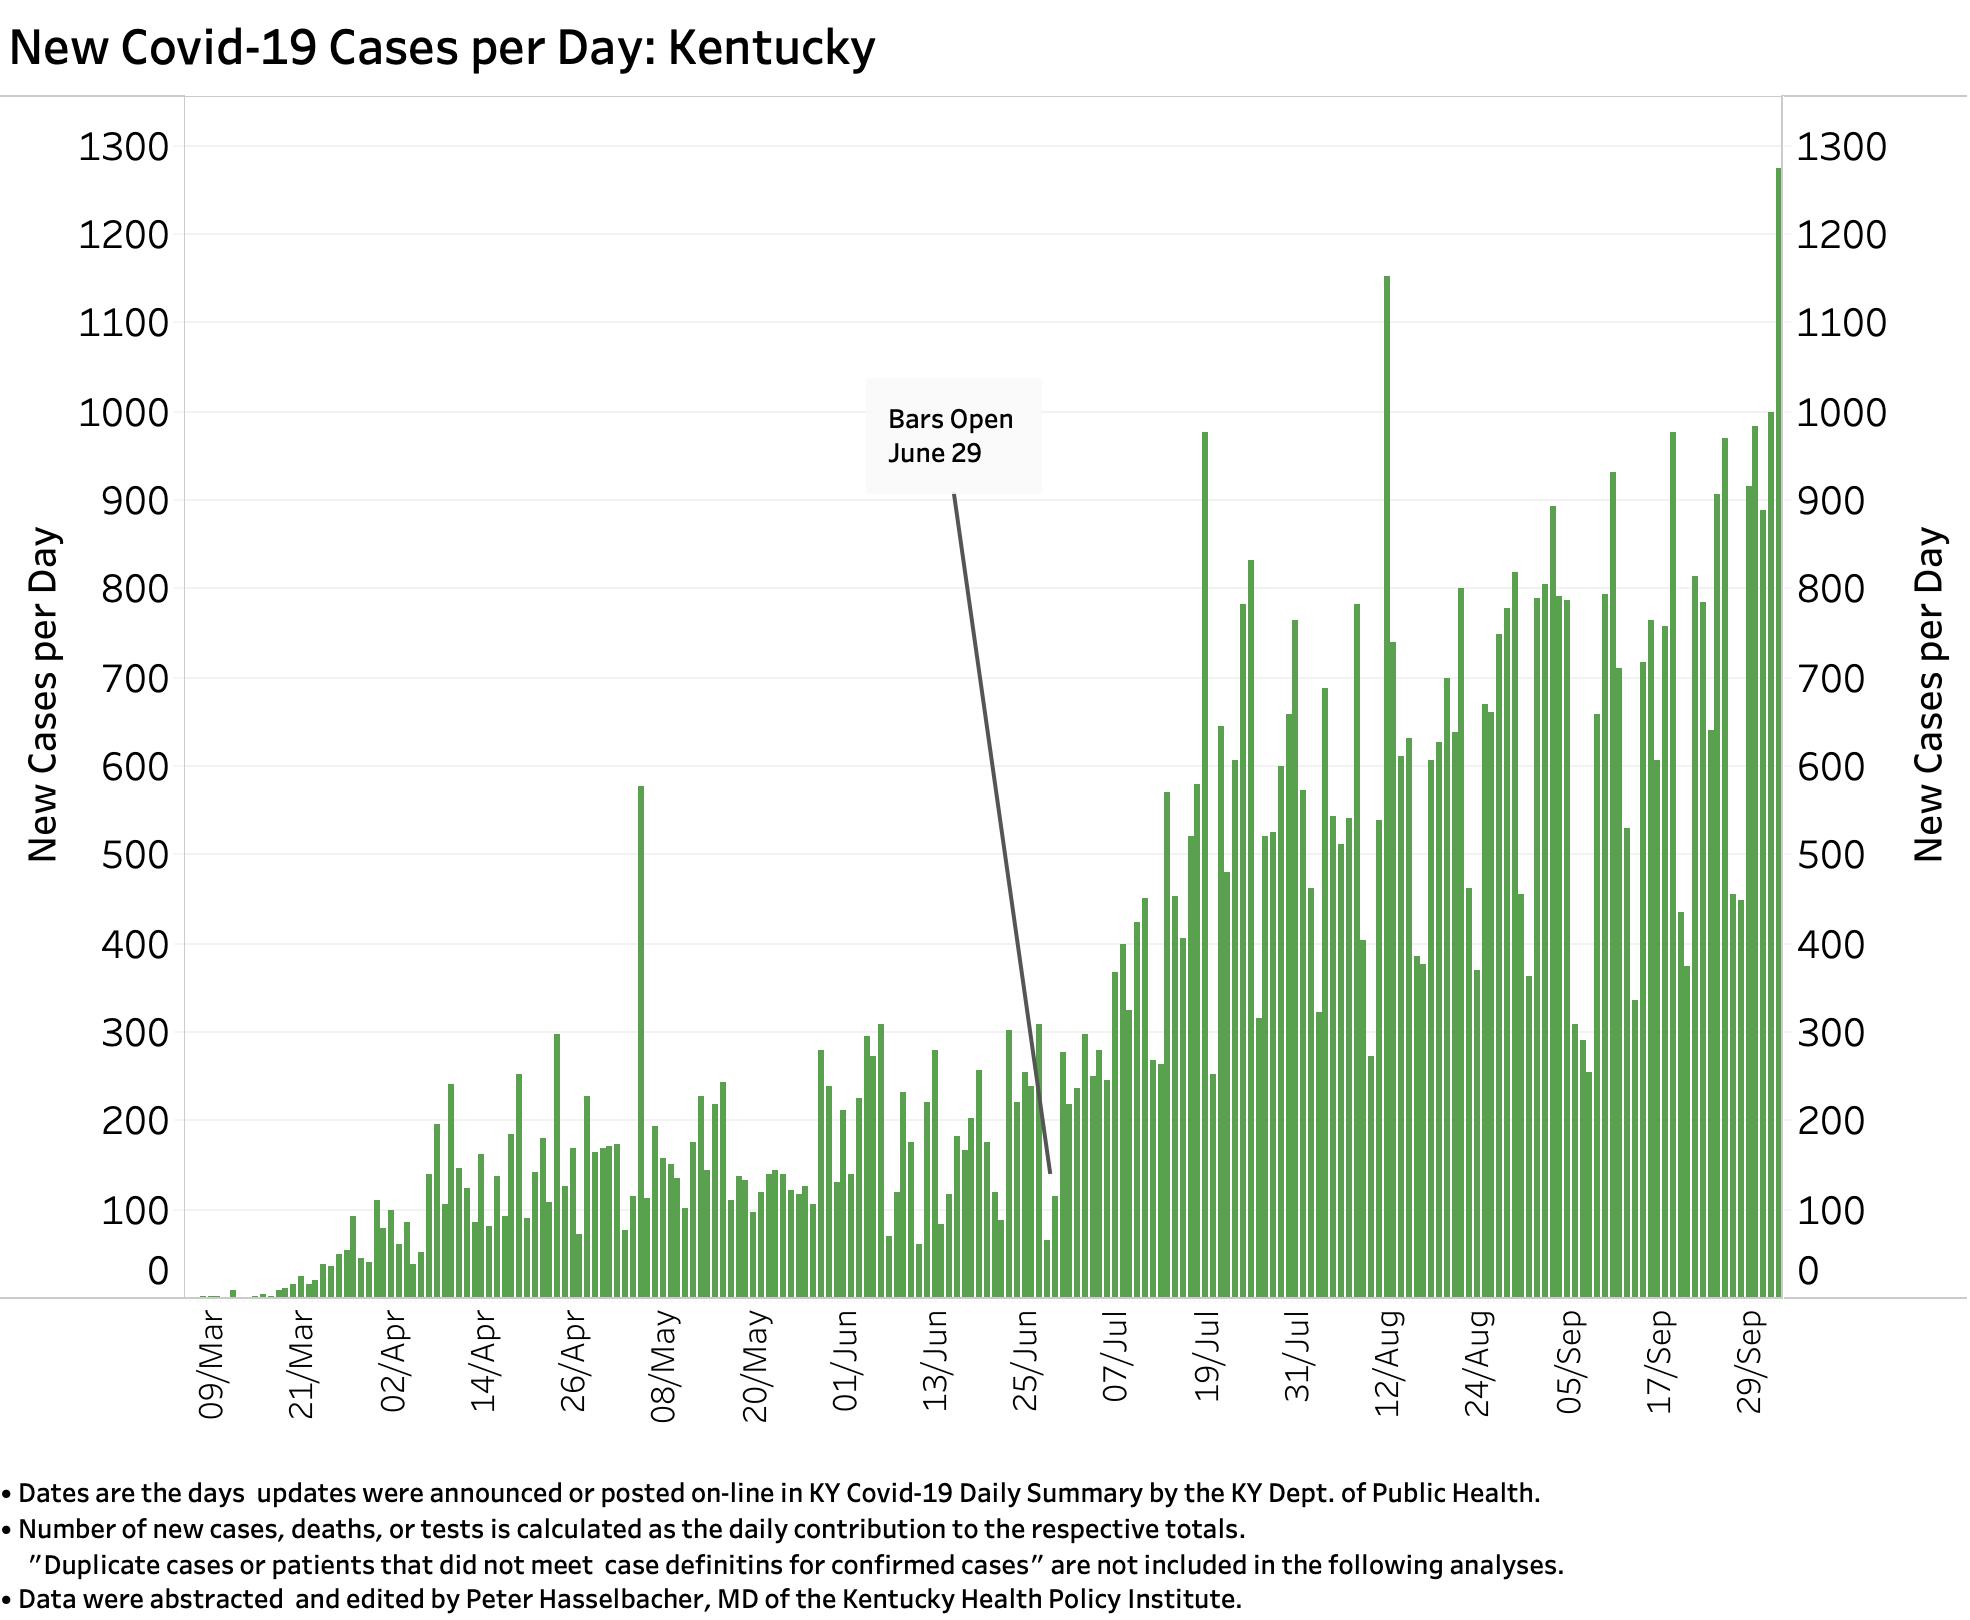
We were given plenty of warning that this week was going to be the worst yet of our first 32 weeks of Covid in Kentucky. It was– by far. With 7444 new confirmed cases, we appeared to leapfrog over the 5965 cases of the previous weekly high that ended October 3d. The height of the jump was artifactually magnified by an unexpected and inexcusably delayed reporting of at least 1472 old cases from Fayette County on October 7. Perhaps this was related to the large numbers of positive tests among students at the University of Kentucky. I am unaware of how far back these cold cases stretched. On the one hand, these strays confuse the significance of the new current state “spike.” On the other, depending on which days the backfill should have been reported, it means that rather than hovering about a possible new higher plateau that would have been the lesser of two evils, that we have been continuously escalating the rate of growth of Kentucky Covid for some weeks. That is not a comfortable possibility. The state deserves better. If Fayette County with all its resources cannot report its cases to Frankfort in a timely and accurate manner, what confidence can we have that the 119 other Kentucky counties, distributed as they are among an assortment of semi-independent public health departments, are not also having difficulties in managing their own local information?

I do not have the information needed to venture much more commentary. I am not aware such has been made public. I offer below a limited assortment of KHPI data visualizations. The full workbook of Covid-19 Tracking graphics is available on KHPI’s Tableau Public website, along with a separate workbook of individual county Covid-19 epidemiologic curves as described in the most recent articles in this series. The following overview graphic shows as well as the more complex visualizations the relentlessly increasing impact of this virus.

Continue reading “Another Bad Week in Kentucky’s Covid-19 Epidemic Compounded by a Major Reporting Failure.”

Serial Map Display of Spread of Covid-19 Across Kentucky.

I should be no surprise to readers that Covid-19 has entered a new and rapidly expanding phase of its presence in Kentucky. It is no longer (and never has been) solely a threat to the larger urban centers of the Commonwealth. Lack of a national strategy, conflicting advice, and poor example from some political leaders has made matters much worse than they had to be. I have been updating KHPI’s Covid-19 tracking page daily and will close out the past week of new record highs with additional commentary Saturday evening.

Watch Covid-19 spread ‘live.’
I want to take this occasion to augment yesterday’s offering to test a newly learned capability of the Tableau software I have been using for its powerful database, statistical, and data visualization capabilities. Using the New York Times Covid-19 County Database, I previously offered static maps that displayed the aggregate number of cases and deaths in each of Kentucky’s 120 counties at a single point in time.

What I have now been able to do is assemble a “filmstrip” of daily maps with a map for each of the 216 days since Covid-19 was first recognized in the state. The result is posted on the KHPI Tableau Public website. Using the date slider control in the panel on the right, the viewer can select any date interactively. There are also buttons (Back-Stop-Forward) to automatically transition one way or the other, but unfortunately on this browser-based platform, the rate of change is rather slow. (The image below is for illustration purposes only. Not a link.)

Continue reading “Serial Map Display of Spread of Covid-19 Across Kentucky.”

Where Have Kentucky’s Covid-19 Cases Been Coming From?

Short Answer: From every single county and at similar rates!

From the first recognized case of Covid-19 disease in Kentucky on March 6 in Fayette County, our epidemic was most easily recognized in larger population centers where there were both more people and access. However, as early as April 1st, 69 of Kentucky’s 120 counties had at least 1 diagnosed case among its people. Only in 35 of those counties were there more than 2 cases. Only in 11 counties were there more than 10 cases. In one short month later on May 1st, there were only 6 counties without a recognized and reported case! By June 2d, only tiny Robertson County was officially reported as free of the disease. By July 1st, the disease was recognized in every county. The last holdouts were centered in the central/eastern part of the state. Of course, just as is true today, unrecognized cases of Covid-19 infection walked among us well before their presence was documented with a specific lab test.

The reader is invited to interactively explore for themself the tables, graphs, and maps that serve as the source of the material presented below. Filters in some of the visualizations allow the user to select a specific county, date, or range of dates to view the data. I will continue to tinker with and add additional visualizations in the online version.

Continue reading “Where Have Kentucky’s Covid-19 Cases Been Coming From?”

New Covid-19 Cases Last Week Set New High Numbers for KY.

A blip, or an accelerated new trend?

Last week’s count of Confirmed New Cases of Covid-19 gave us new highs for both a single day and the week– and by no small measures. On Saturday, 1274 confirmed new cases were added to Kentucky’s total. The total for the week (Sunday to Saturday) was greater than 1000 new cases higher than the previous week–which was itself a record high. Monthly new cases continue to rise at a similar pace.

Daily new Confirmed Cases of Covid-19 in KY as of 10-3-20.
Continue reading “New Covid-19 Cases Last Week Set New High Numbers for KY.”